
MQT_RencoBarTimer tracks the exact amount of time required to form each Renko bar. It displays bar‑formation duration in milliseconds, seconds, minutes, or hours, and optionally shows the live chart time directly on the chart.
Back to IndicatorsMeasures how long each Renko bar takes to complete.
Display bar time in milliseconds, seconds, minutes, or hours.
Updates continuously using OnEachTick calculation.
Correctly resets timing at session boundaries.
Show current bar time as fixed text in the chart corner.
Displays time values as vertical bars beneath price.
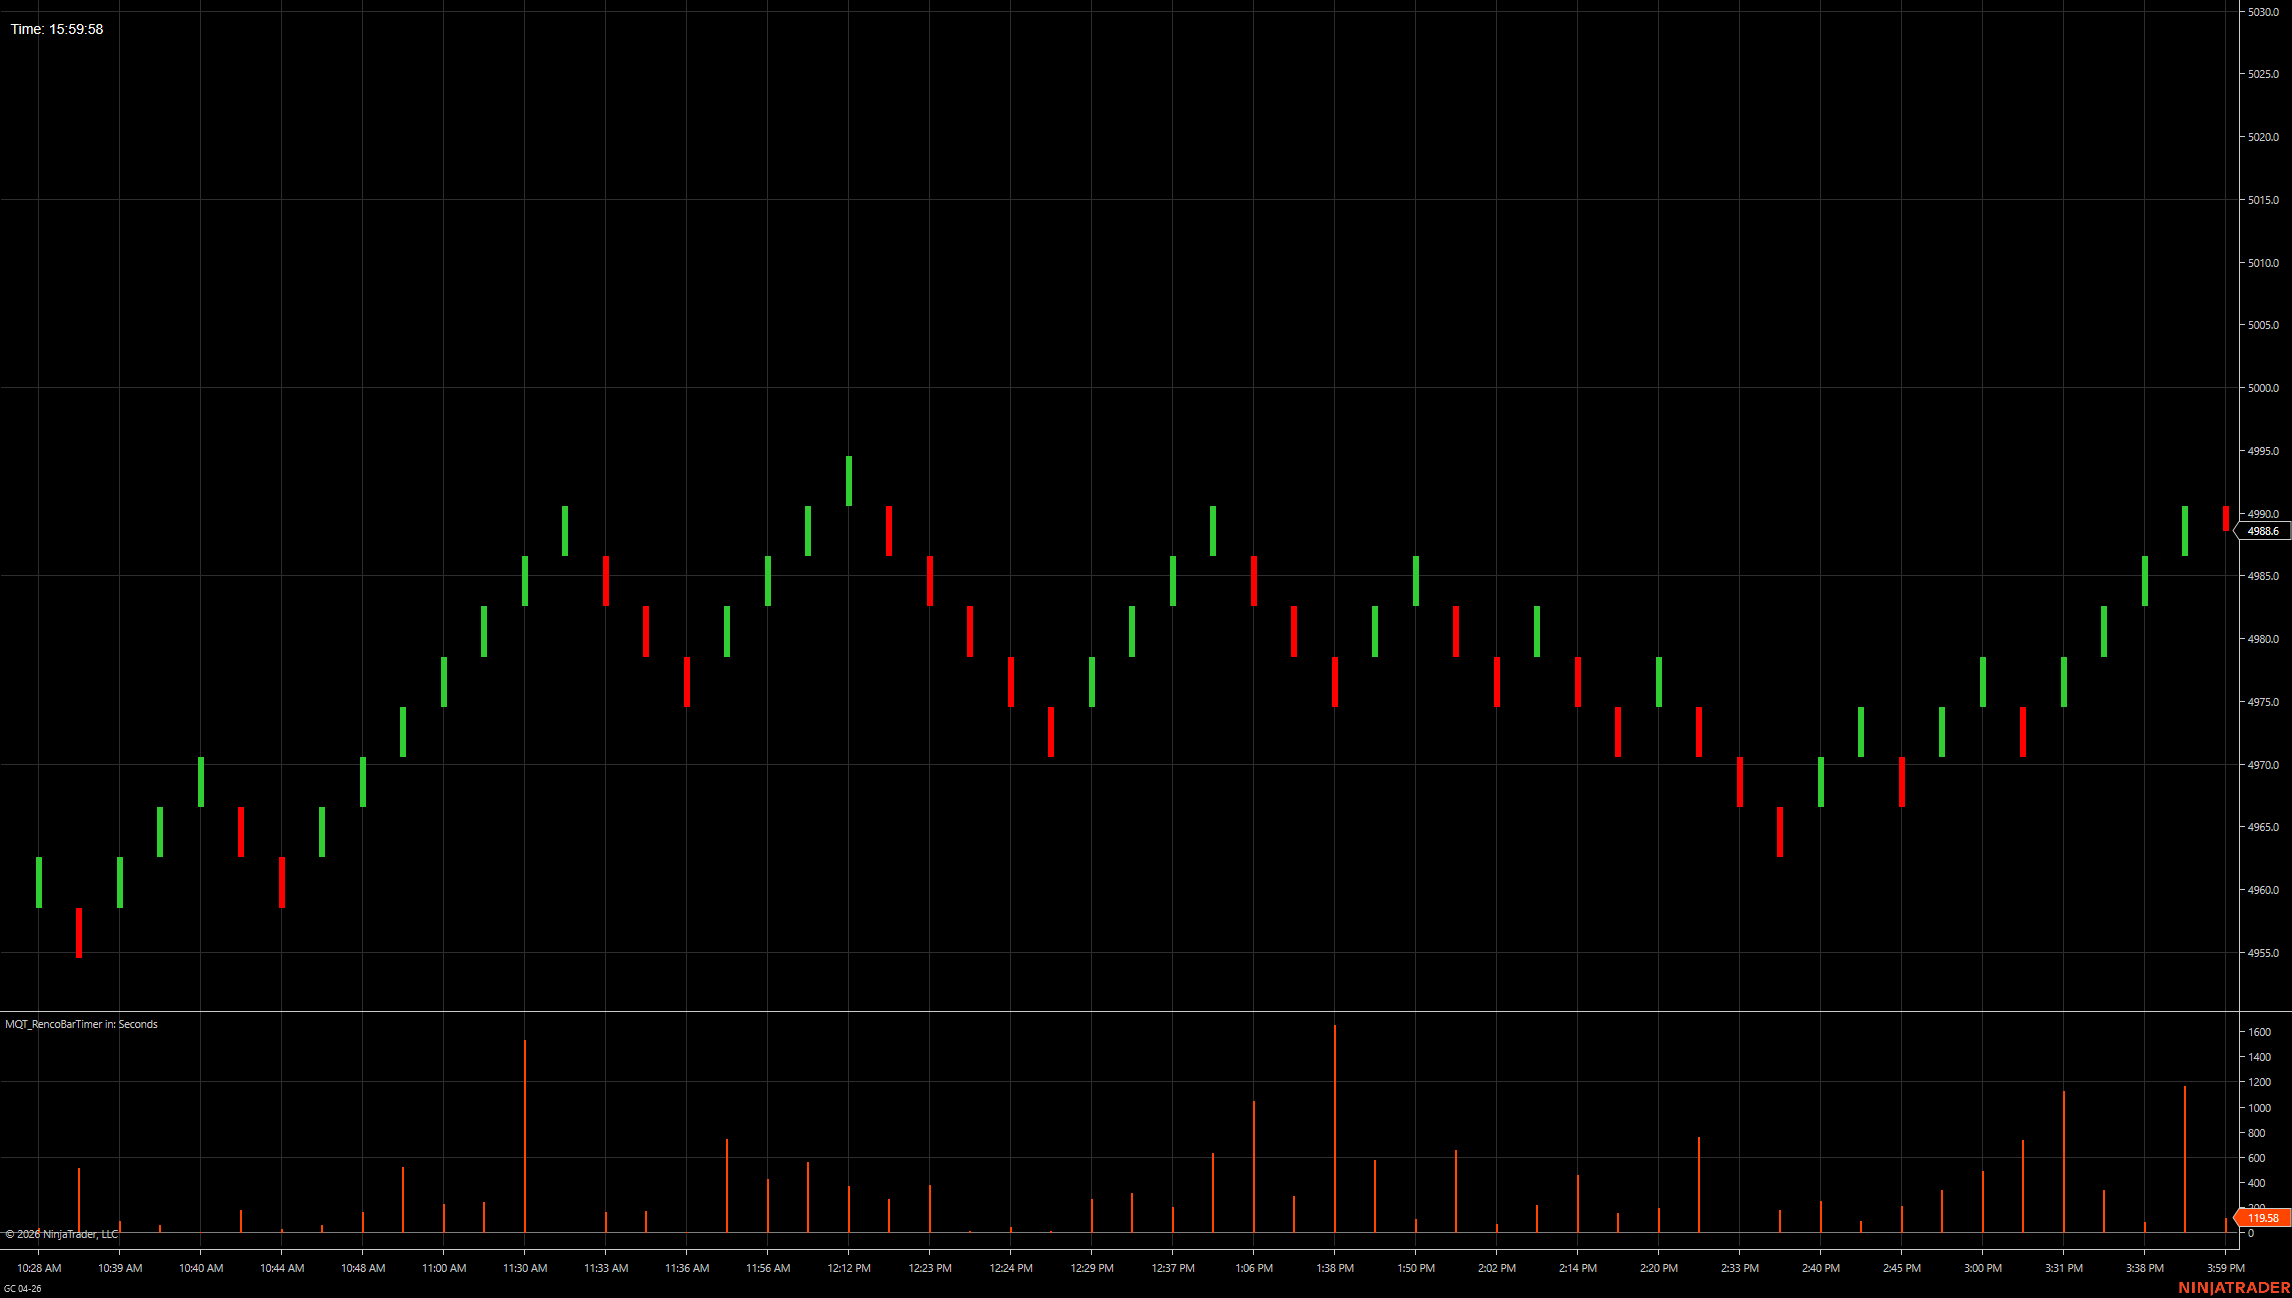
Seconds required to complete each Renko bar
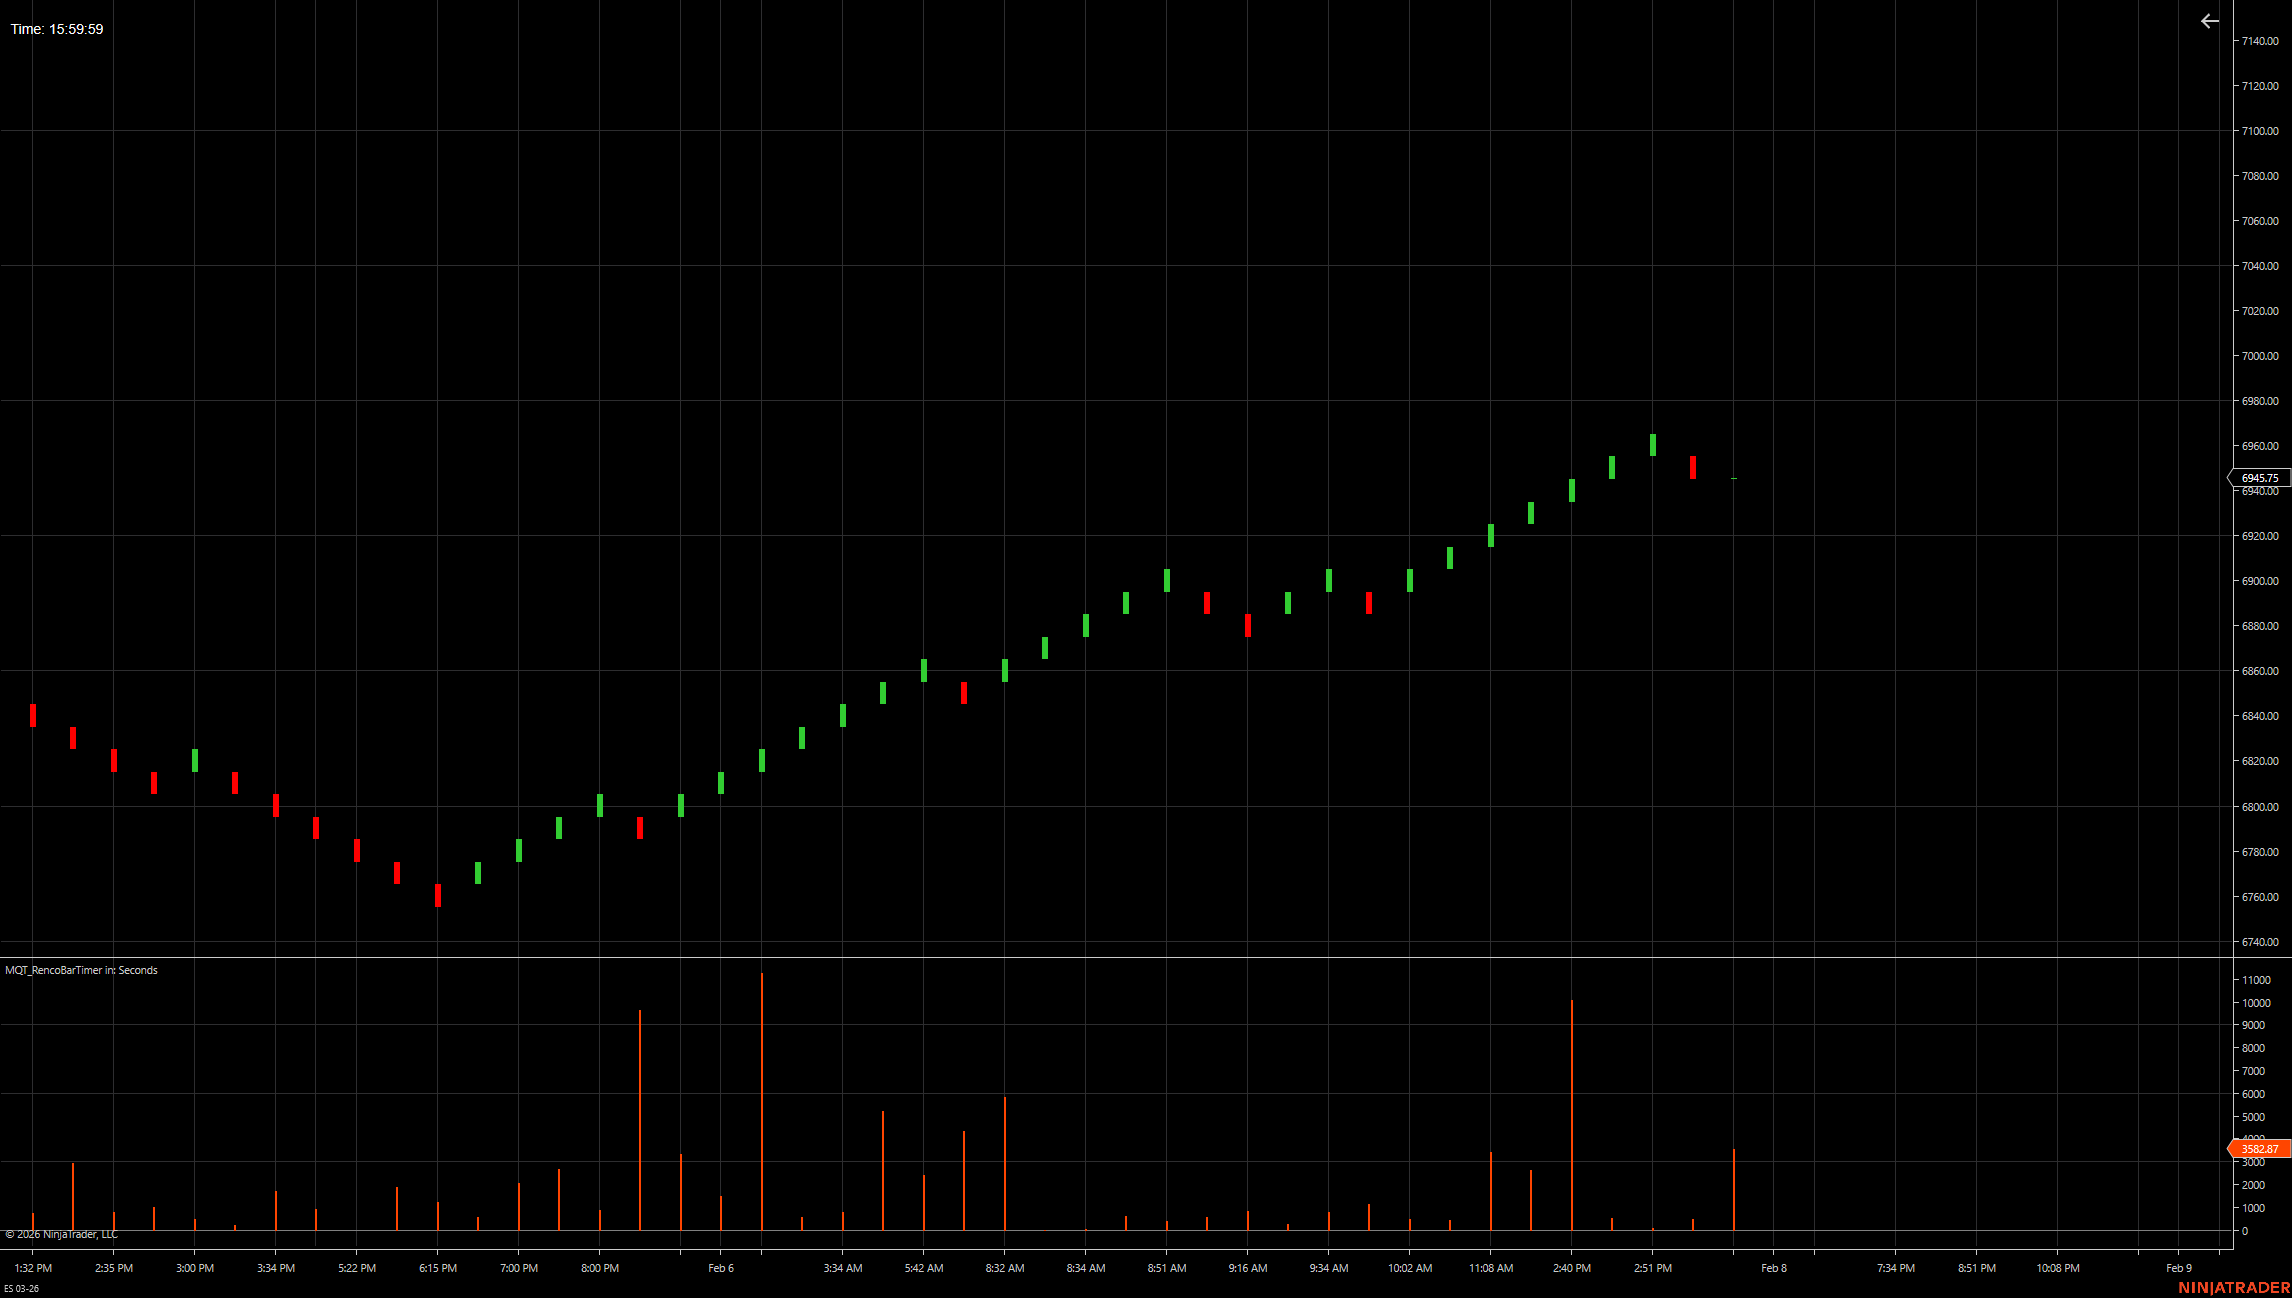
Accurate bar timing across overnight sessions
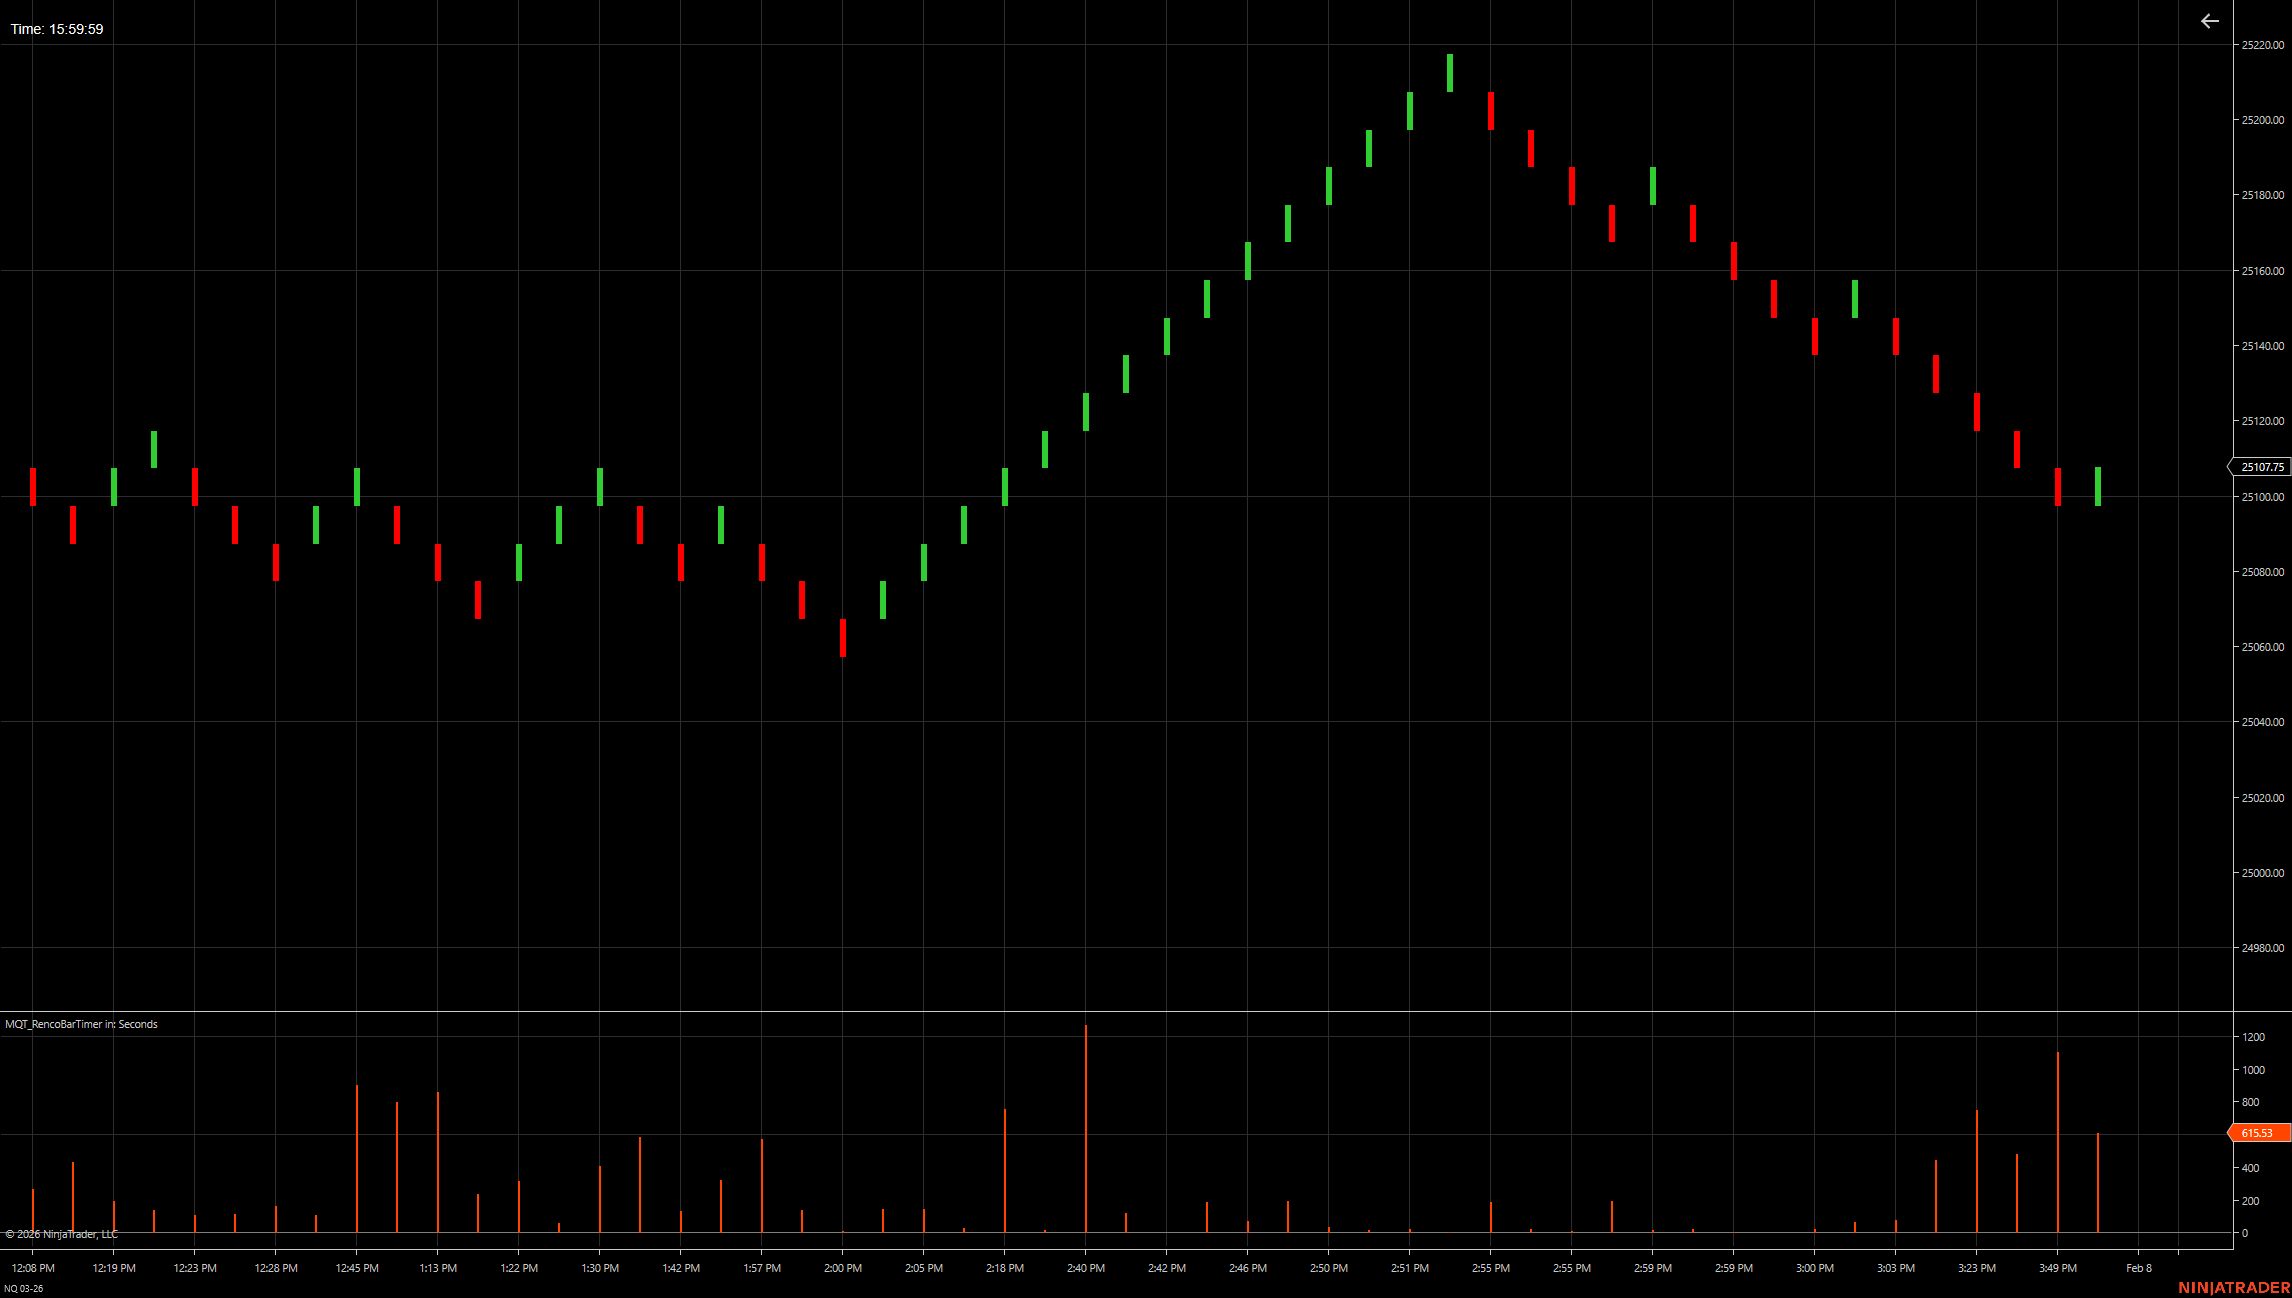
Quickly identify fast vs slow Renko conditions
Records the timestamp of each bar transition.
Calculates elapsed time since the previous bar.
Converts time into the selected unit.
Displays timing as bars in a dedicated panel.
| Setting | Type | Typical Values | Description |
|---|---|---|---|
| Time Unit | Dropdown | ms / sec / min / hrs | Selects the unit used to display bar‑formation duration. |
| Show Current Chart Time | Boolean | On / Off | Displays the live chart time as fixed text in a chart corner (optional). |
| Text Location | Dropdown | Top‑Left / Top‑Right / Bottom‑Left / Bottom‑Right | Controls where the optional chart‑time text is anchored. |
| Plot Style | Style | Bars / Histogram | Controls the appearance of the sub‑panel timing plot. |
| Session Reset Behavior | Behavior | Default | Defines how timing resets at session boundaries to prevent carryover across sessions. |
| Font / Text Size | Style | Small / Medium / Large | Adjusts the size of any fixed‑text display (if enabled). |
| Color Settings | Style | Default / Custom | Controls plot and text colors for visibility on dark charts. |
Note: The exact parameter names and defaults depend on your current build. If you paste the indicator’s NinjaTrader property section (or C# code), I can convert this into exact names + default values (matching your code 1:1).
It’s designed for Renko bar formation timing. On time‑based charts, “bar duration” is fixed by the timeframe, so the indicator is most useful on non‑time‑based bars like Renko.
Renko bars form faster during high volatility and slower during low volatility. Session transitions and illiquid periods can also create longer formation times.
The live (currently forming) bar’s time will change until that bar completes. Once a bar closes, its measured formation duration is fixed.
Many traders use formation time as a volatility proxy—filtering trades when bars are forming unusually fast (high momentum) or unusually slow (chop/low energy).
Yes—session‑aware logic is intended to prevent bar‑time carryover across session boundaries. Your chart’s Trading Hours template still matters.
Seconds are a common default. Use milliseconds for very fast markets/bars, or minutes/hours when bars can take a long time to form.
It updates on each tick to keep the timing accurate. On very high‑tick instruments, that can be heavier than OnBarClose indicators, but it’s typically lightweight.
Yes—enable the optional chart‑time display and choose the corner location in settings.