
MQT_PivotConfluencePredictor uses cycle, swing, Fibonacci, and multi-timeframe analysis with AutoTune and Learning to predict the next pivot confluence zone for NinjaTrader 8.
Back to Indicators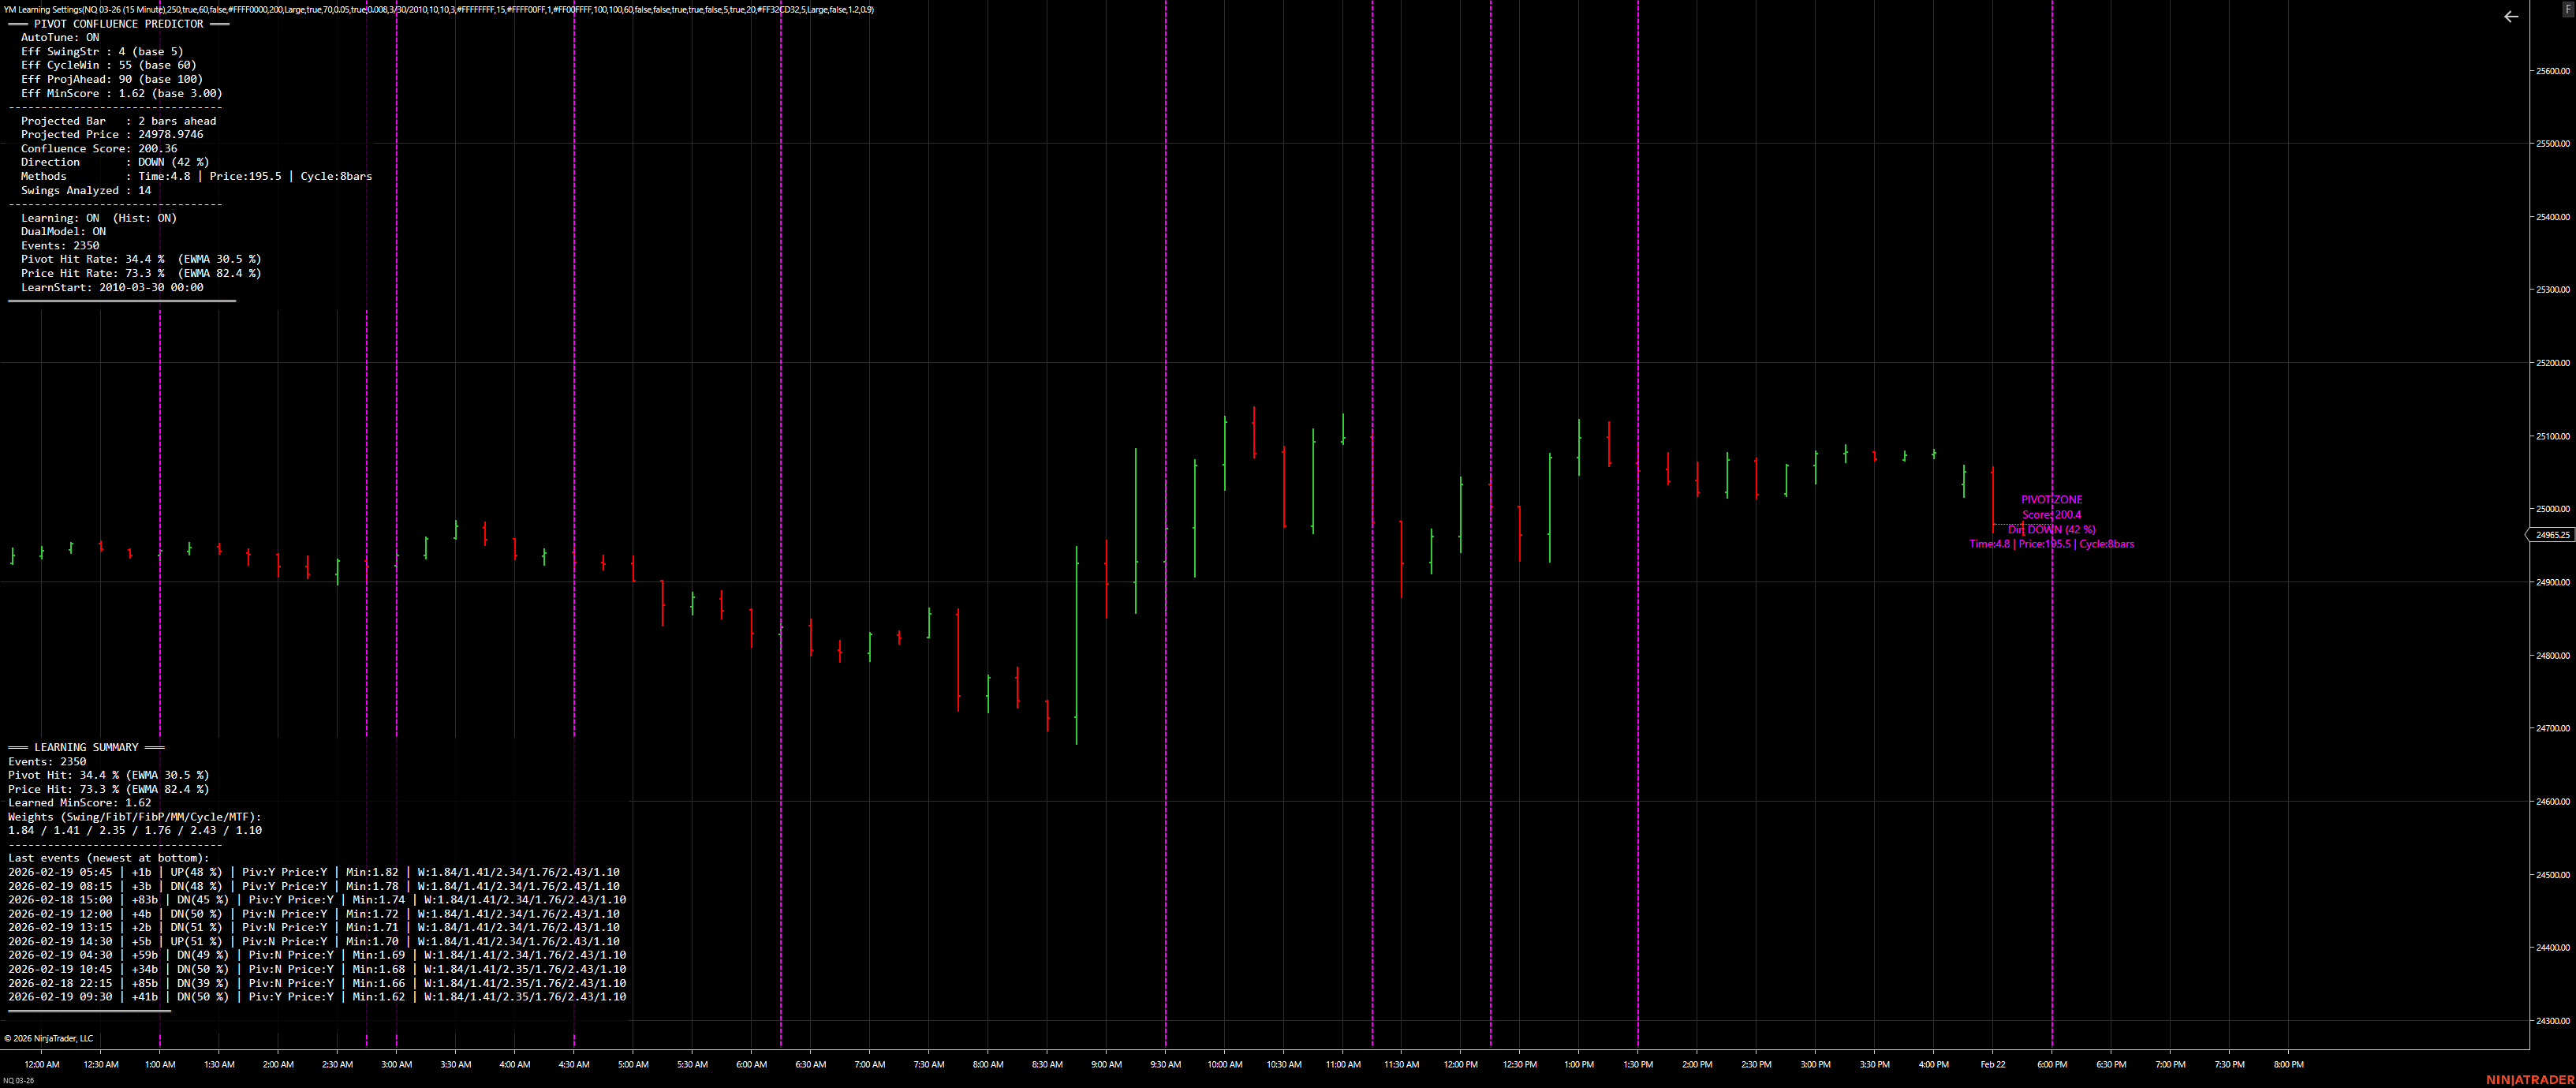
Shows pivot zones, learning summary, and projected arrows on price action.
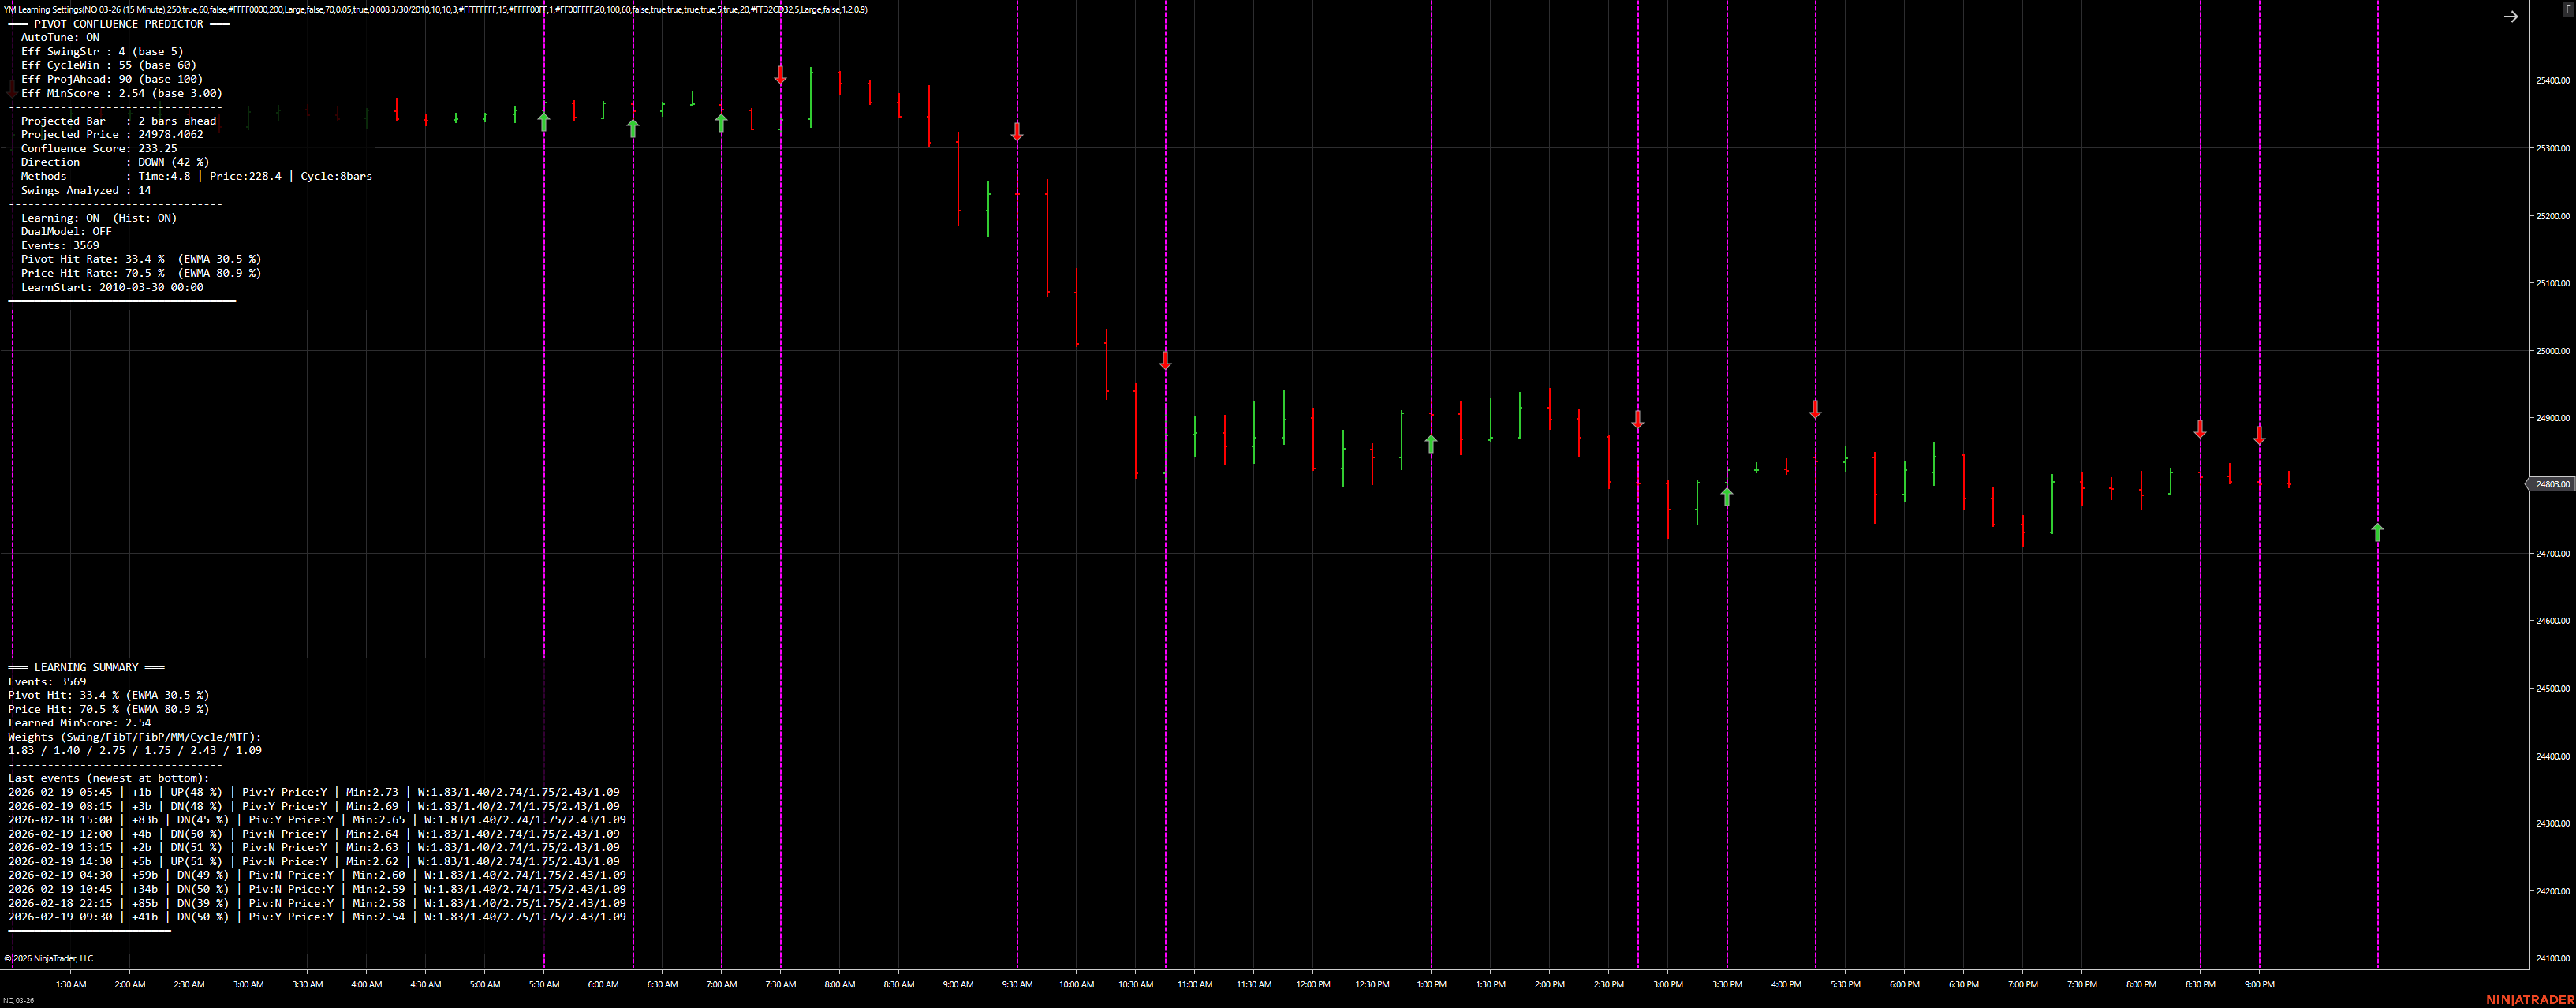
Detailed view of pivot hits, score panel, and learning events.
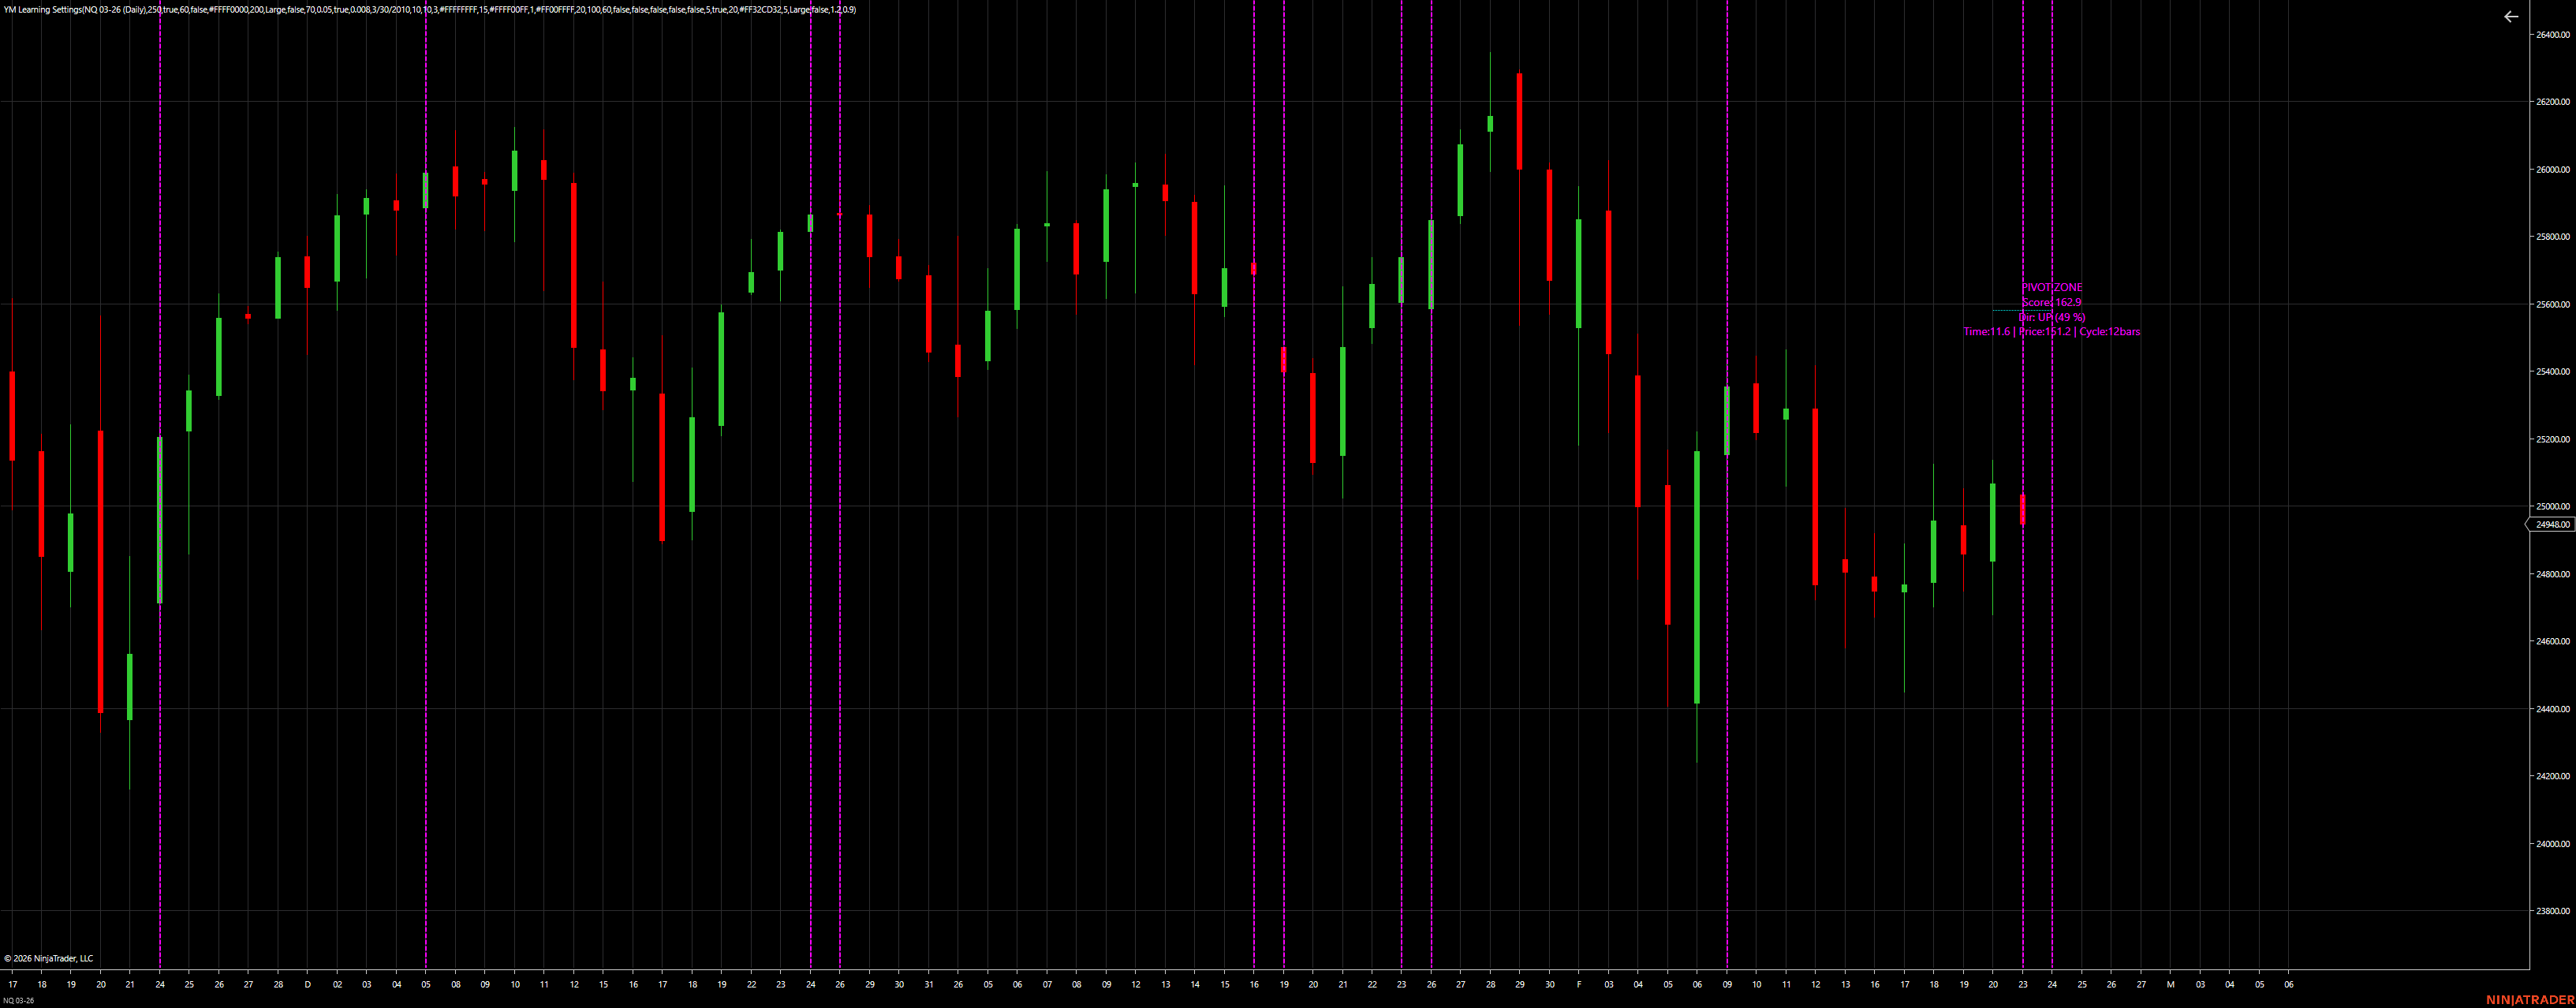
Multi-timeframe swing and cycle analysis with projected pivot zones.
Detects swing highs and lows using configurable swing strength and lookback.
Combines multiple methods including Fibonacci, cycle, and measured moves to project future pivot zones.
Adaptive settings based on market regime and ongoing learning from realized outcomes.
Draws vertical pivot lines, price levels, and directional arrows with customizable colors and sizes.
| Category | Setting | Description |
|---|---|---|
| Swing Detection | Swing Strength | Bars on each side to confirm swing high/low. |
| Swing Detection | Lookback Swings | Number of prior swings used for analysis. |
| Cycle Analysis | Cycle Search Window | Max autocorrelation lag to find dominant cycle. |
| Projection | Projection Bars Ahead | Bars ahead to scan for confluence peak. |
| Projection | Min Confluence Score | Minimum score to draw a projection. |
| Display | Show Score Panel | Overlay score breakdown panel on chart. |
| Display | Show Learning Summary | Overlay learning summary panel. |
| Display | Learning Summary Max Events | Number of recent learning events to list. |
| Display | Use Infinite Price Line | True = infinite horizontal price line. |
| Display | Show Up Arrows | Toggle projected BUY/up arrows. |
| Display | Show Down Arrows | Toggle projected SELL/down arrows. |
| Display | Up Arrow Offset (ticks) | Ticks below projected price for Up arrow. |
| Display | Down Arrow Offset (ticks) | Ticks above projected price for Down arrow. |
| Display | Up Arrow Size | Marker size for Up arrow. |
| Display | Down Arrow Size | Marker size for Down arrow. |
| Display | Up Arrow Color | Color of Up arrow. |
| Display | Down Arrow Color | Color of Down arrow. |
| Display | Pivot Line Color | Color of pivot vertical lines. |
| Display | Price Line Color | Color of price horizontal lines. |
| Display Text Style | Panel Text Size | Font size for overlay text panels. |
| Display Text Style | Panel Text Color | Color of overlay text panels. |
| AutoTune | AutoTune Enabled | Adaptive settings based on volatility/trend regime. |
| AutoTune | Regime Update Every (bars) | Frequency to recompute regime and adjust settings. |
| AutoTune | Vol Low Threshold (ATR ratio) | ATR(14)/SMA(ATR,100) below this is quiet. |
| AutoTune | Vol High Threshold (ATR ratio) | ATR(14)/SMA(ATR,100) above this is hot. |
| AutoTune | Trend Threshold (ADX) | ADX(14) above this is trending. |
| Learning | Learning Enabled | Updates weights and thresholds from outcomes. |
| Learning | Train On Historical | Apply learning on historical bars. |
| Learning | Learning Start Date | Start date/time for historical learning. |
| Learning | Evaluation Horizon (bars) | Bars after projection to evaluate outcomes. |
| Learning | Pivot Tolerance (bars) | Pivot timing hit tolerance in bars. |
| Learning | Price Tolerance (ticks) | Price touch hit tolerance in ticks. |
| Learning | Learning Rate | Step size for weight/threshold updates. |
| Learning | EWMA Alpha | Smoothing for pivot/price accuracy. |
| Learning | Dual-Model Learner | Separate learners for pivot and price. |
| Learning | Reset Learned Each Session | Reset in-memory stats on realtime start. |
| Learning | Delete Learned File On Start | Delete persistence file on load. |
| Learning | Autosave Every (bars) | Save learned state every N bars. |
Predicts future pivot confluence zones using cycle, swing, Fibonacci, and multi-timeframe analysis.
Yes, fully compatible and designed specifically for NinjaTrader 8.
Yes, all learning and AutoTune parameters are configurable.
No, it uses confirmed swing points and historical data for projections.
Yes, it supports multi-timeframe analysis with multiple data series.
The score panel breaks down the weighted contributions of different methods to the projection score.