
MQT_ORB_PercentRange shows how much of the full trading session’s range is created during a specific intraday window such as the Opening Range. Real‑time percentages and optional historical averages provide immediate volatility context.
Back to IndicatorsQuantifies how much of the day’s total range forms early.
Supports any session, including non‑RTH and overnight windows.
Instant feedback on volatility expansion as the session unfolds.
Compare today’s ORB strength to historical norms.
Clean, non‑intrusive text drawn in a fixed chart location.
Each trading day is tracked independently with archived history.
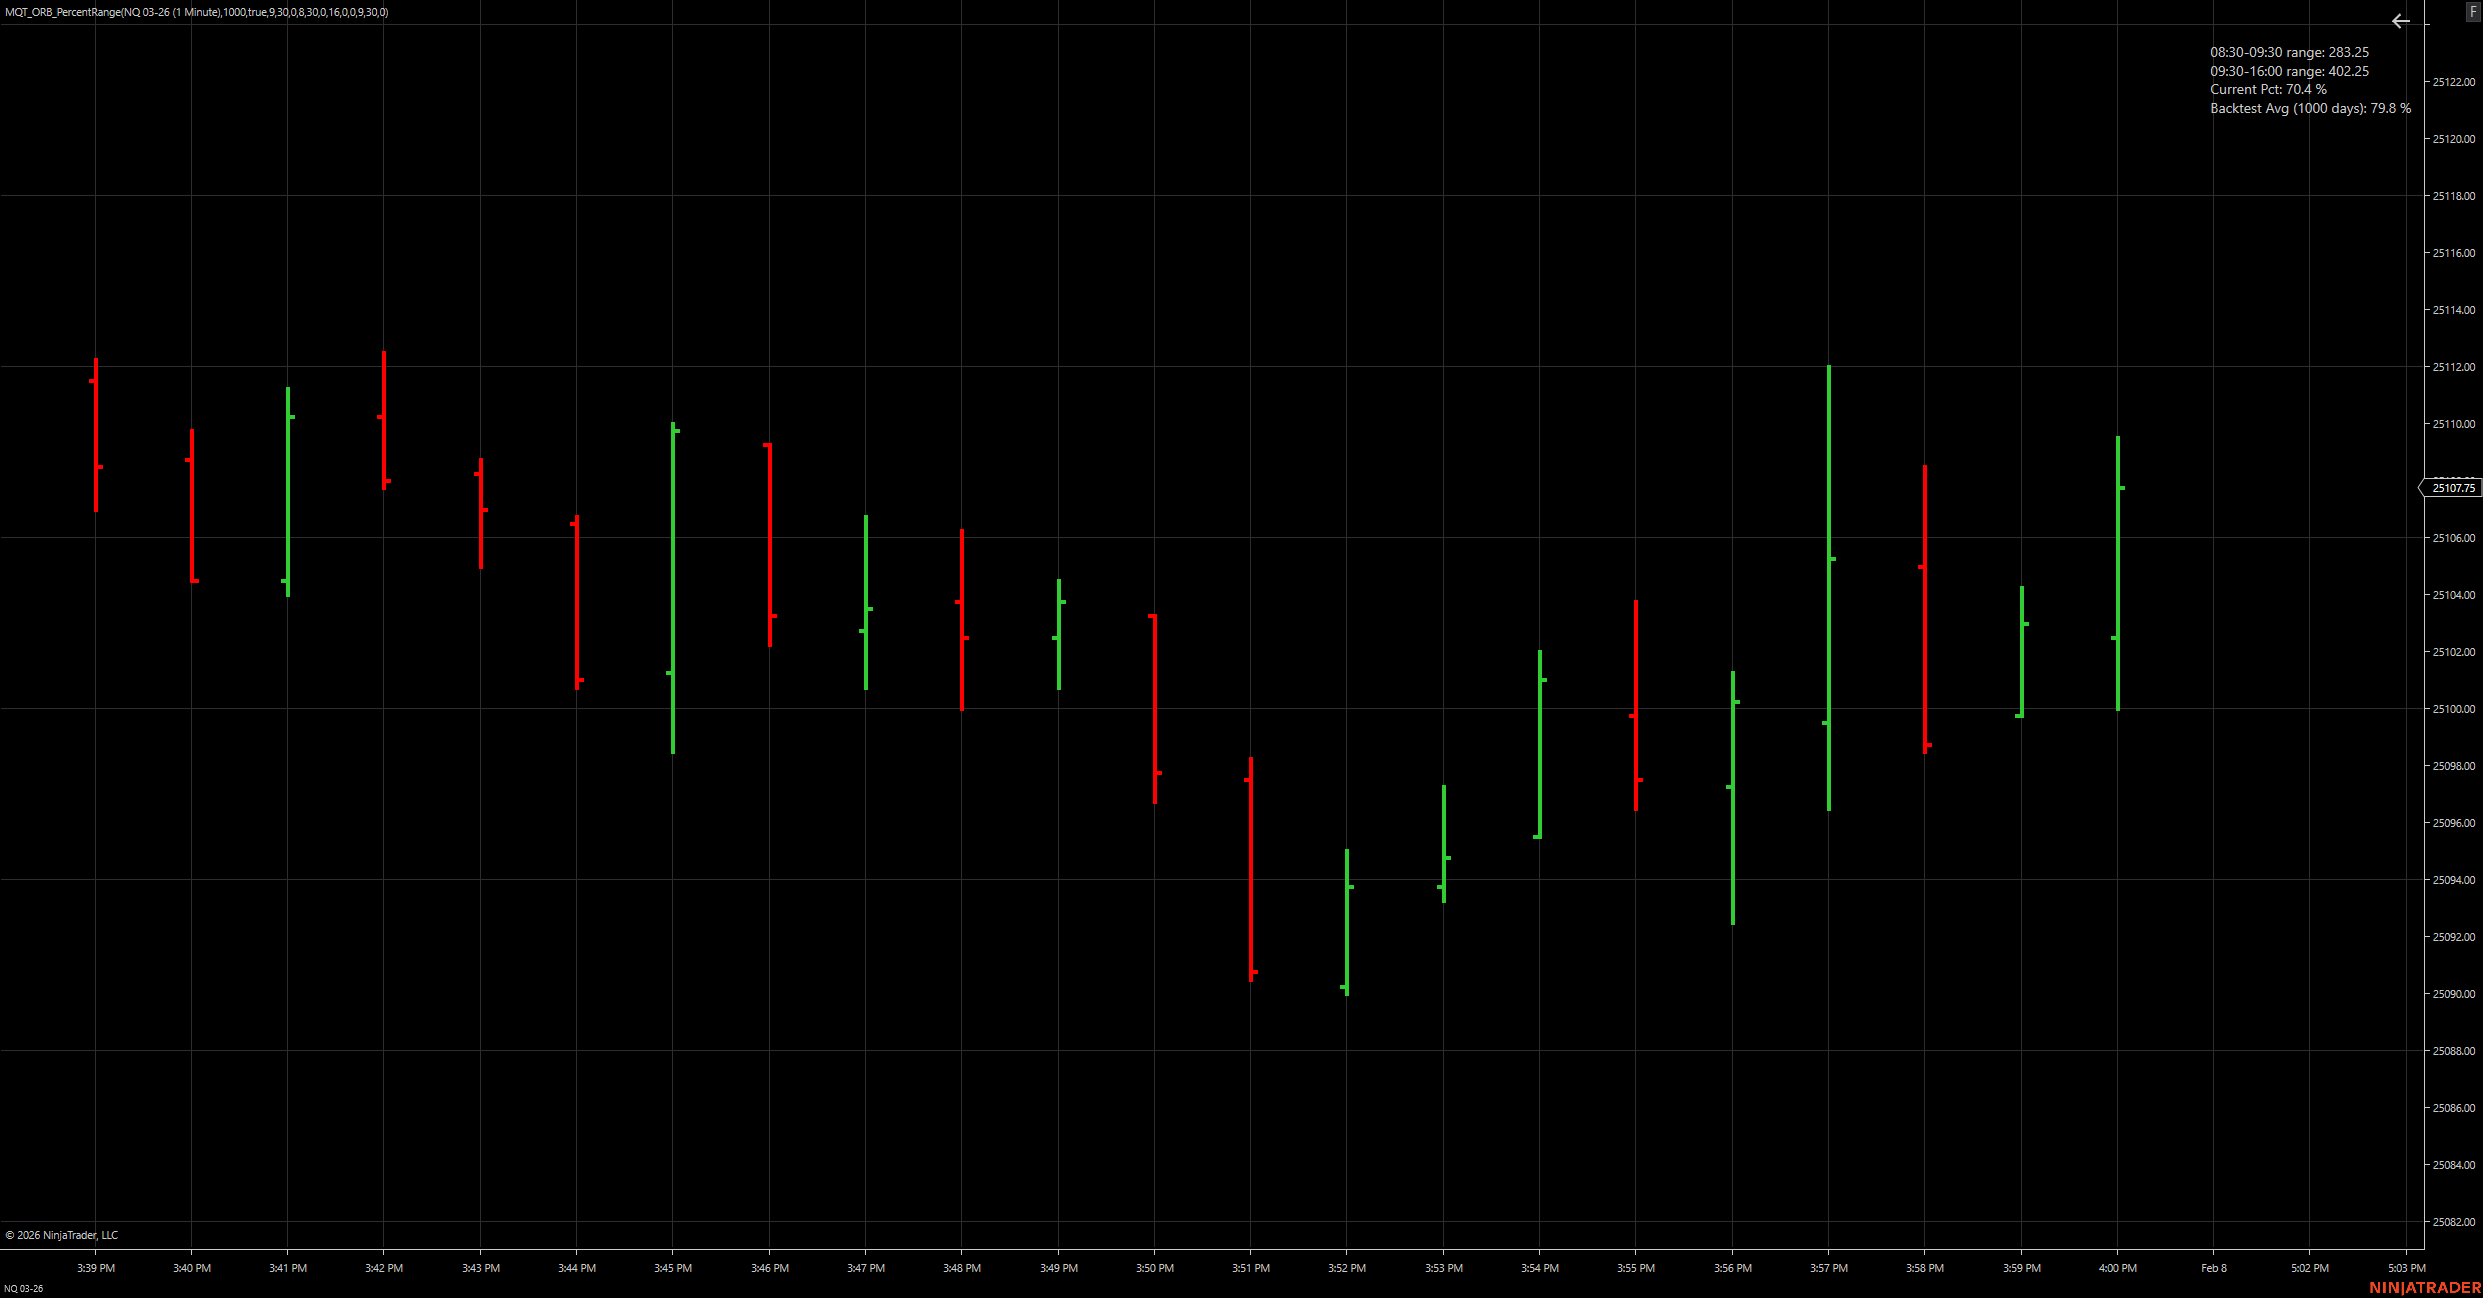
Opening range contribution vs full session
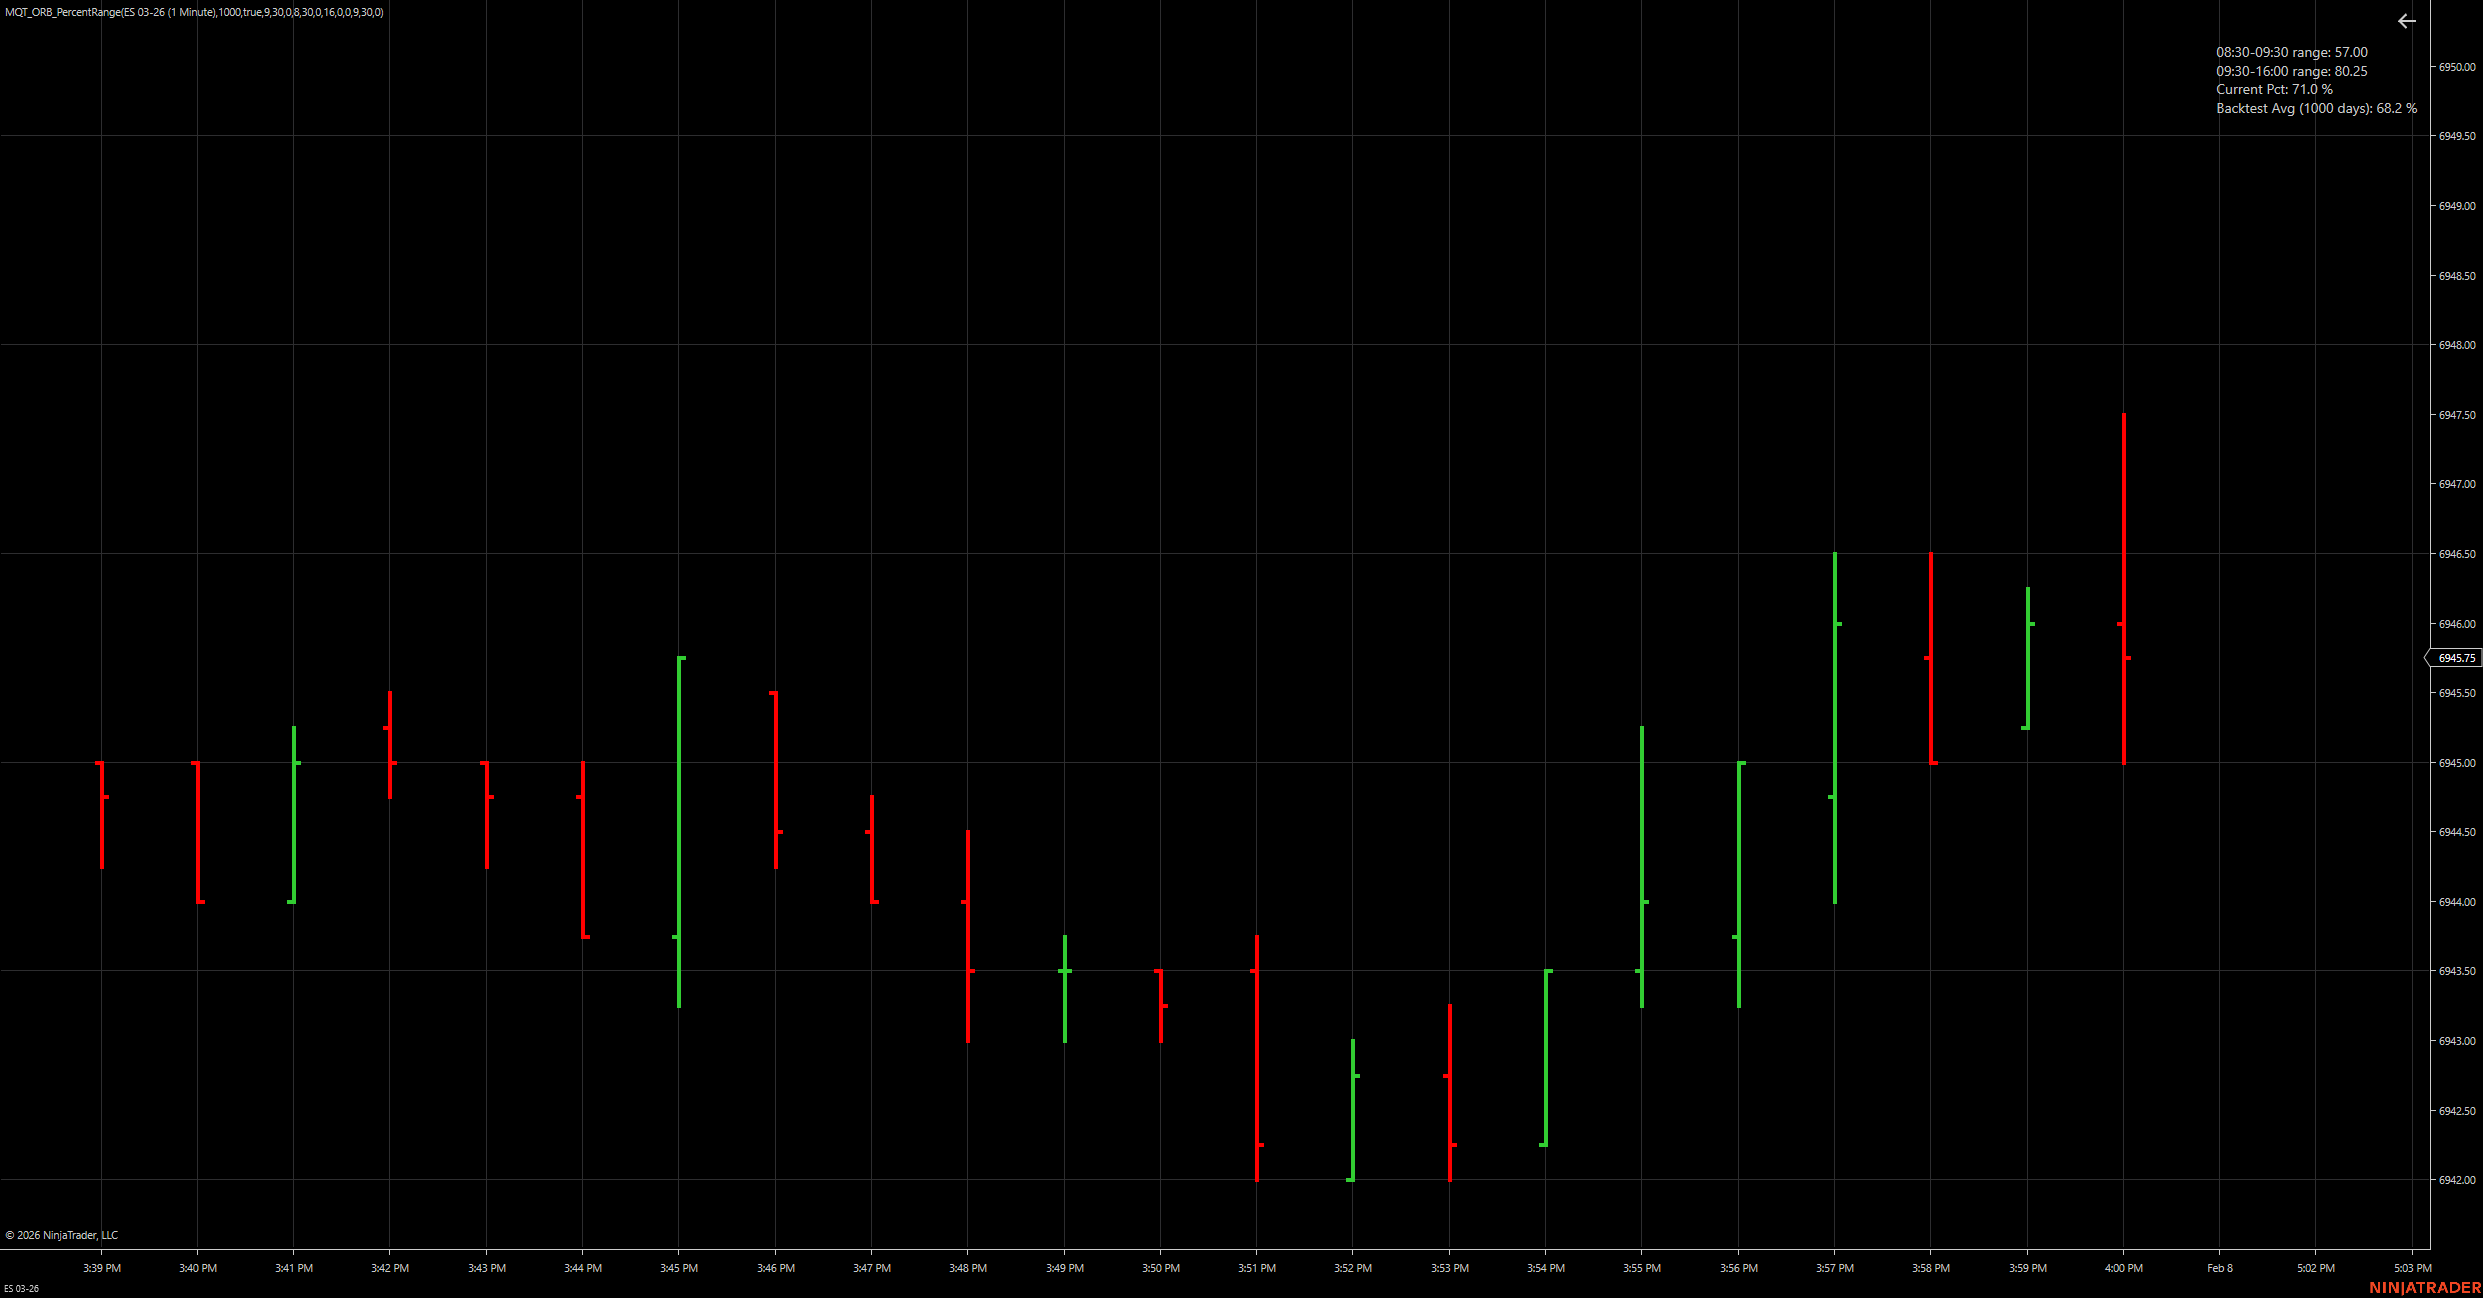
Live percentage compared to backtest average
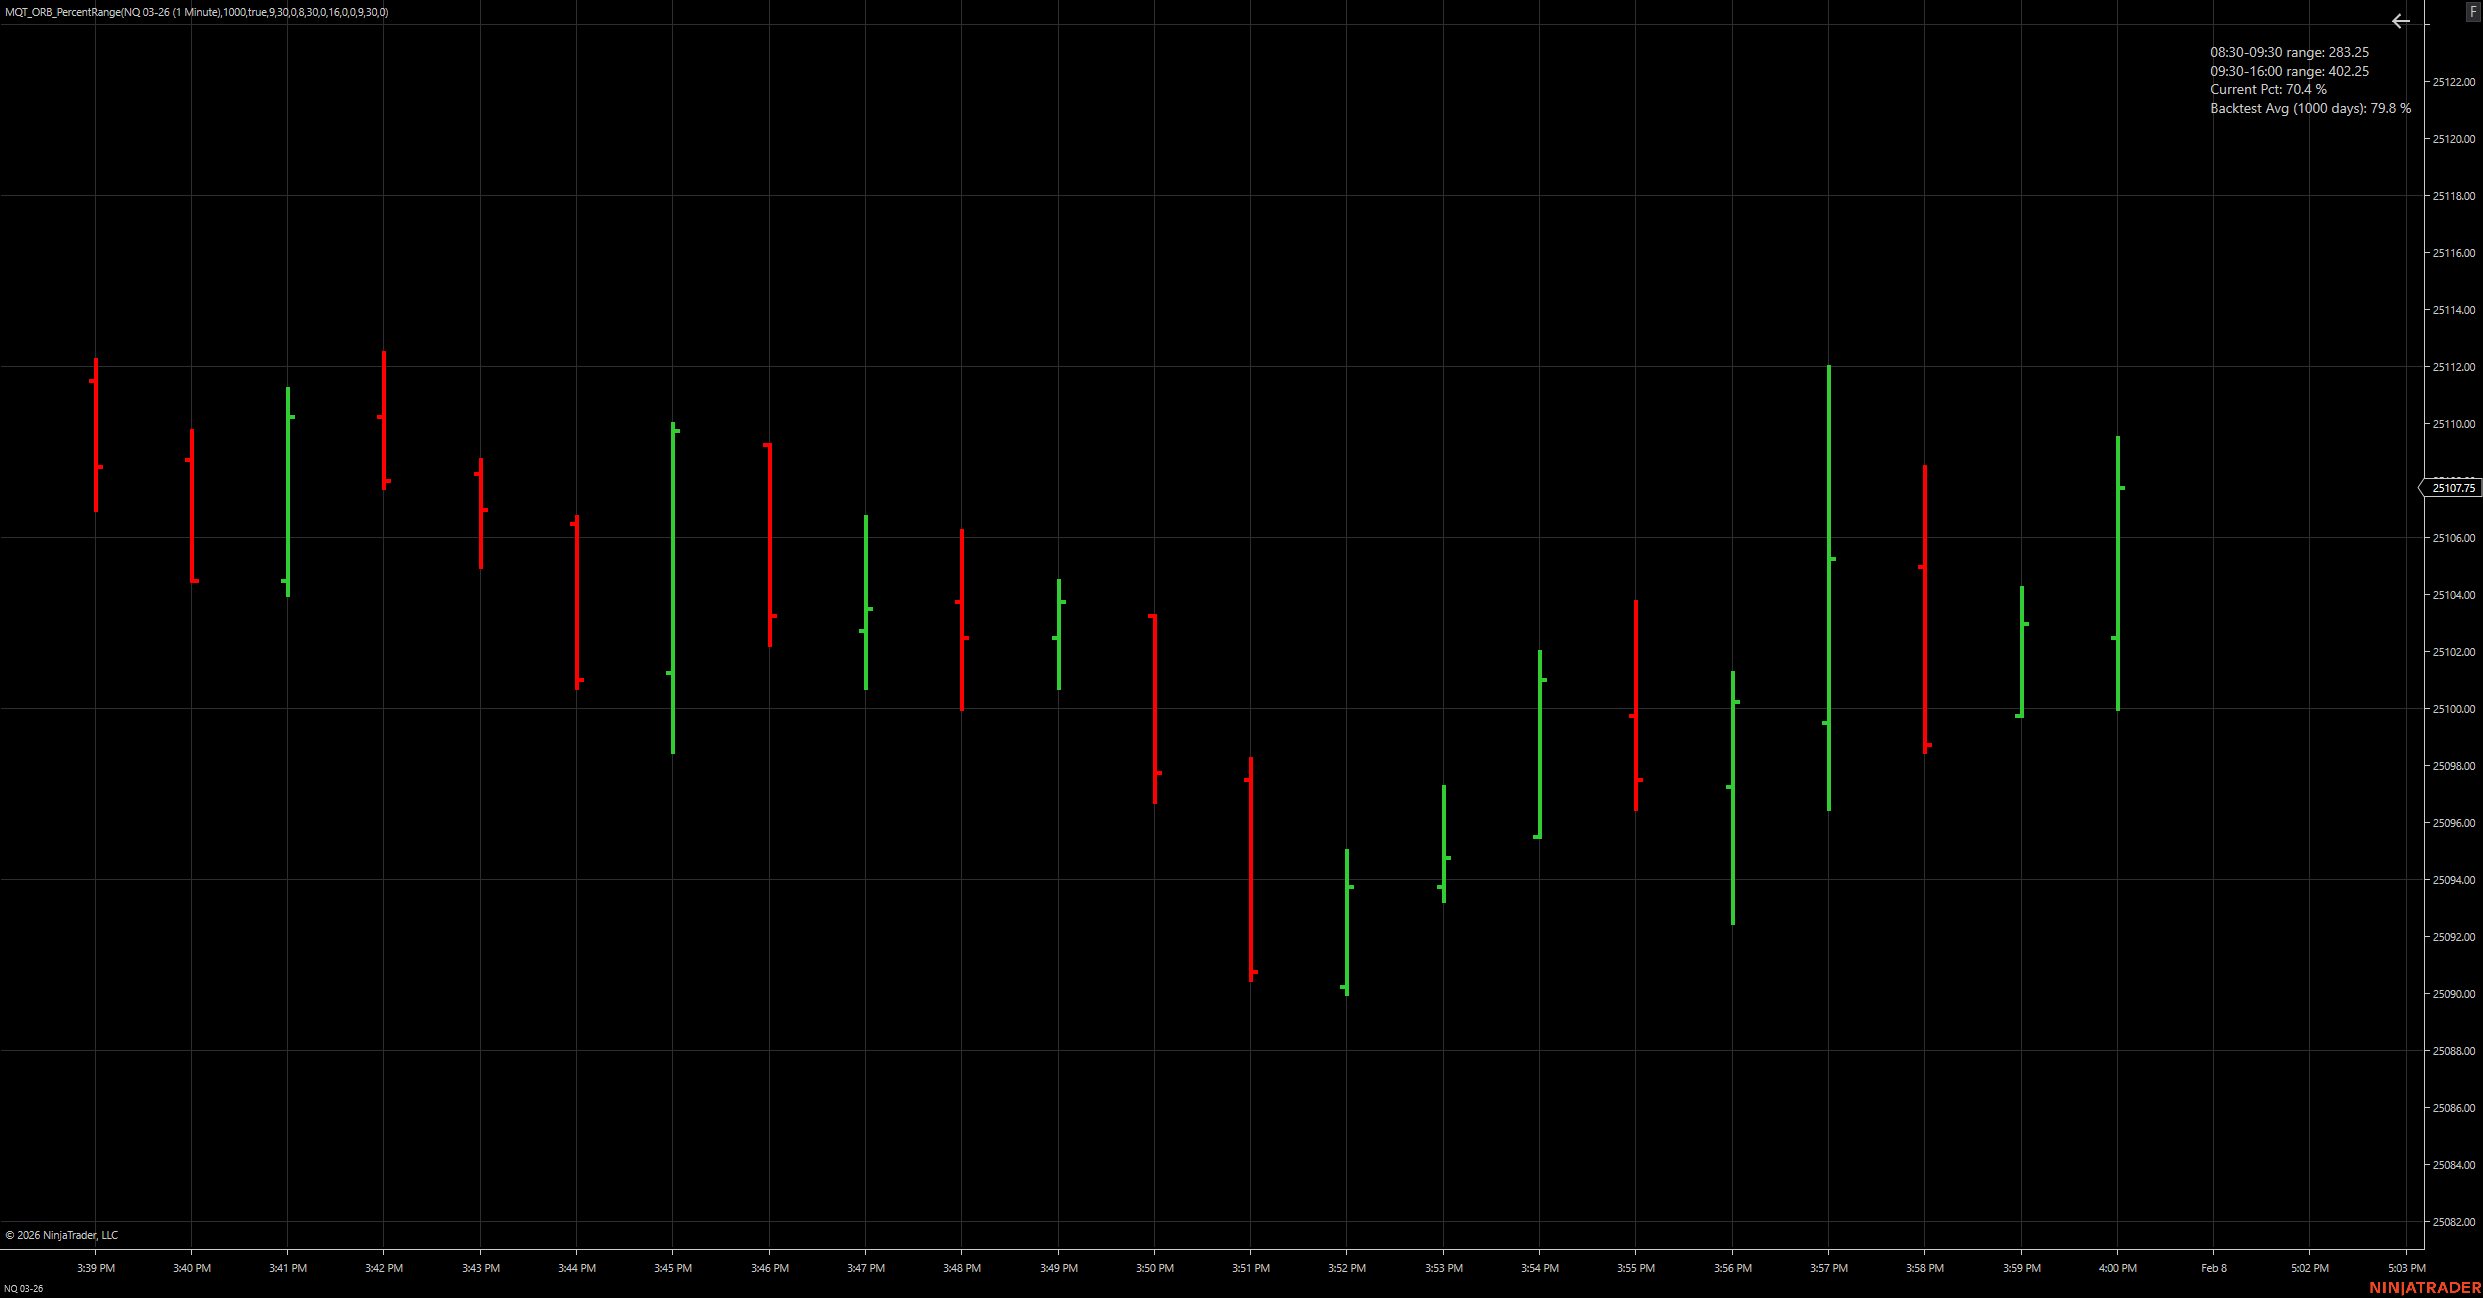
Early session strength measured against full range
High/low values are recorded for intraday and full‑day windows.
The intraday range is divided by the full session range.
Daily values are saved for rolling backtest averages.
Results are shown as fixed text directly on the chart.
No. All values are calculated on completed bars only.
Yes. Both windows are fully configurable.
It controls how many prior sessions are averaged.
No. It works on any market or timeframe.