
MQT_MultiLengthSlopes displays real‑time slope angles (in degrees) for both High and Low prices, with optional multi‑bar slope comparisons, automatic color coding, flat‑slope filtering, and CSV export for advanced analysis.
Back to IndicatorsDisplays precise slope angles for both High and Low price movement on each bar.
Calculate slopes between any two historical bars for deeper structural analysis.
Green for positive slope, red for negative slope — instantly readable.
Automatically hide near‑flat slopes using a configurable degree threshold.
Independently toggle degree labels and slope lines for a clean chart.
Export slope data (High, Low, additional slopes) for spreadsheet or research use.
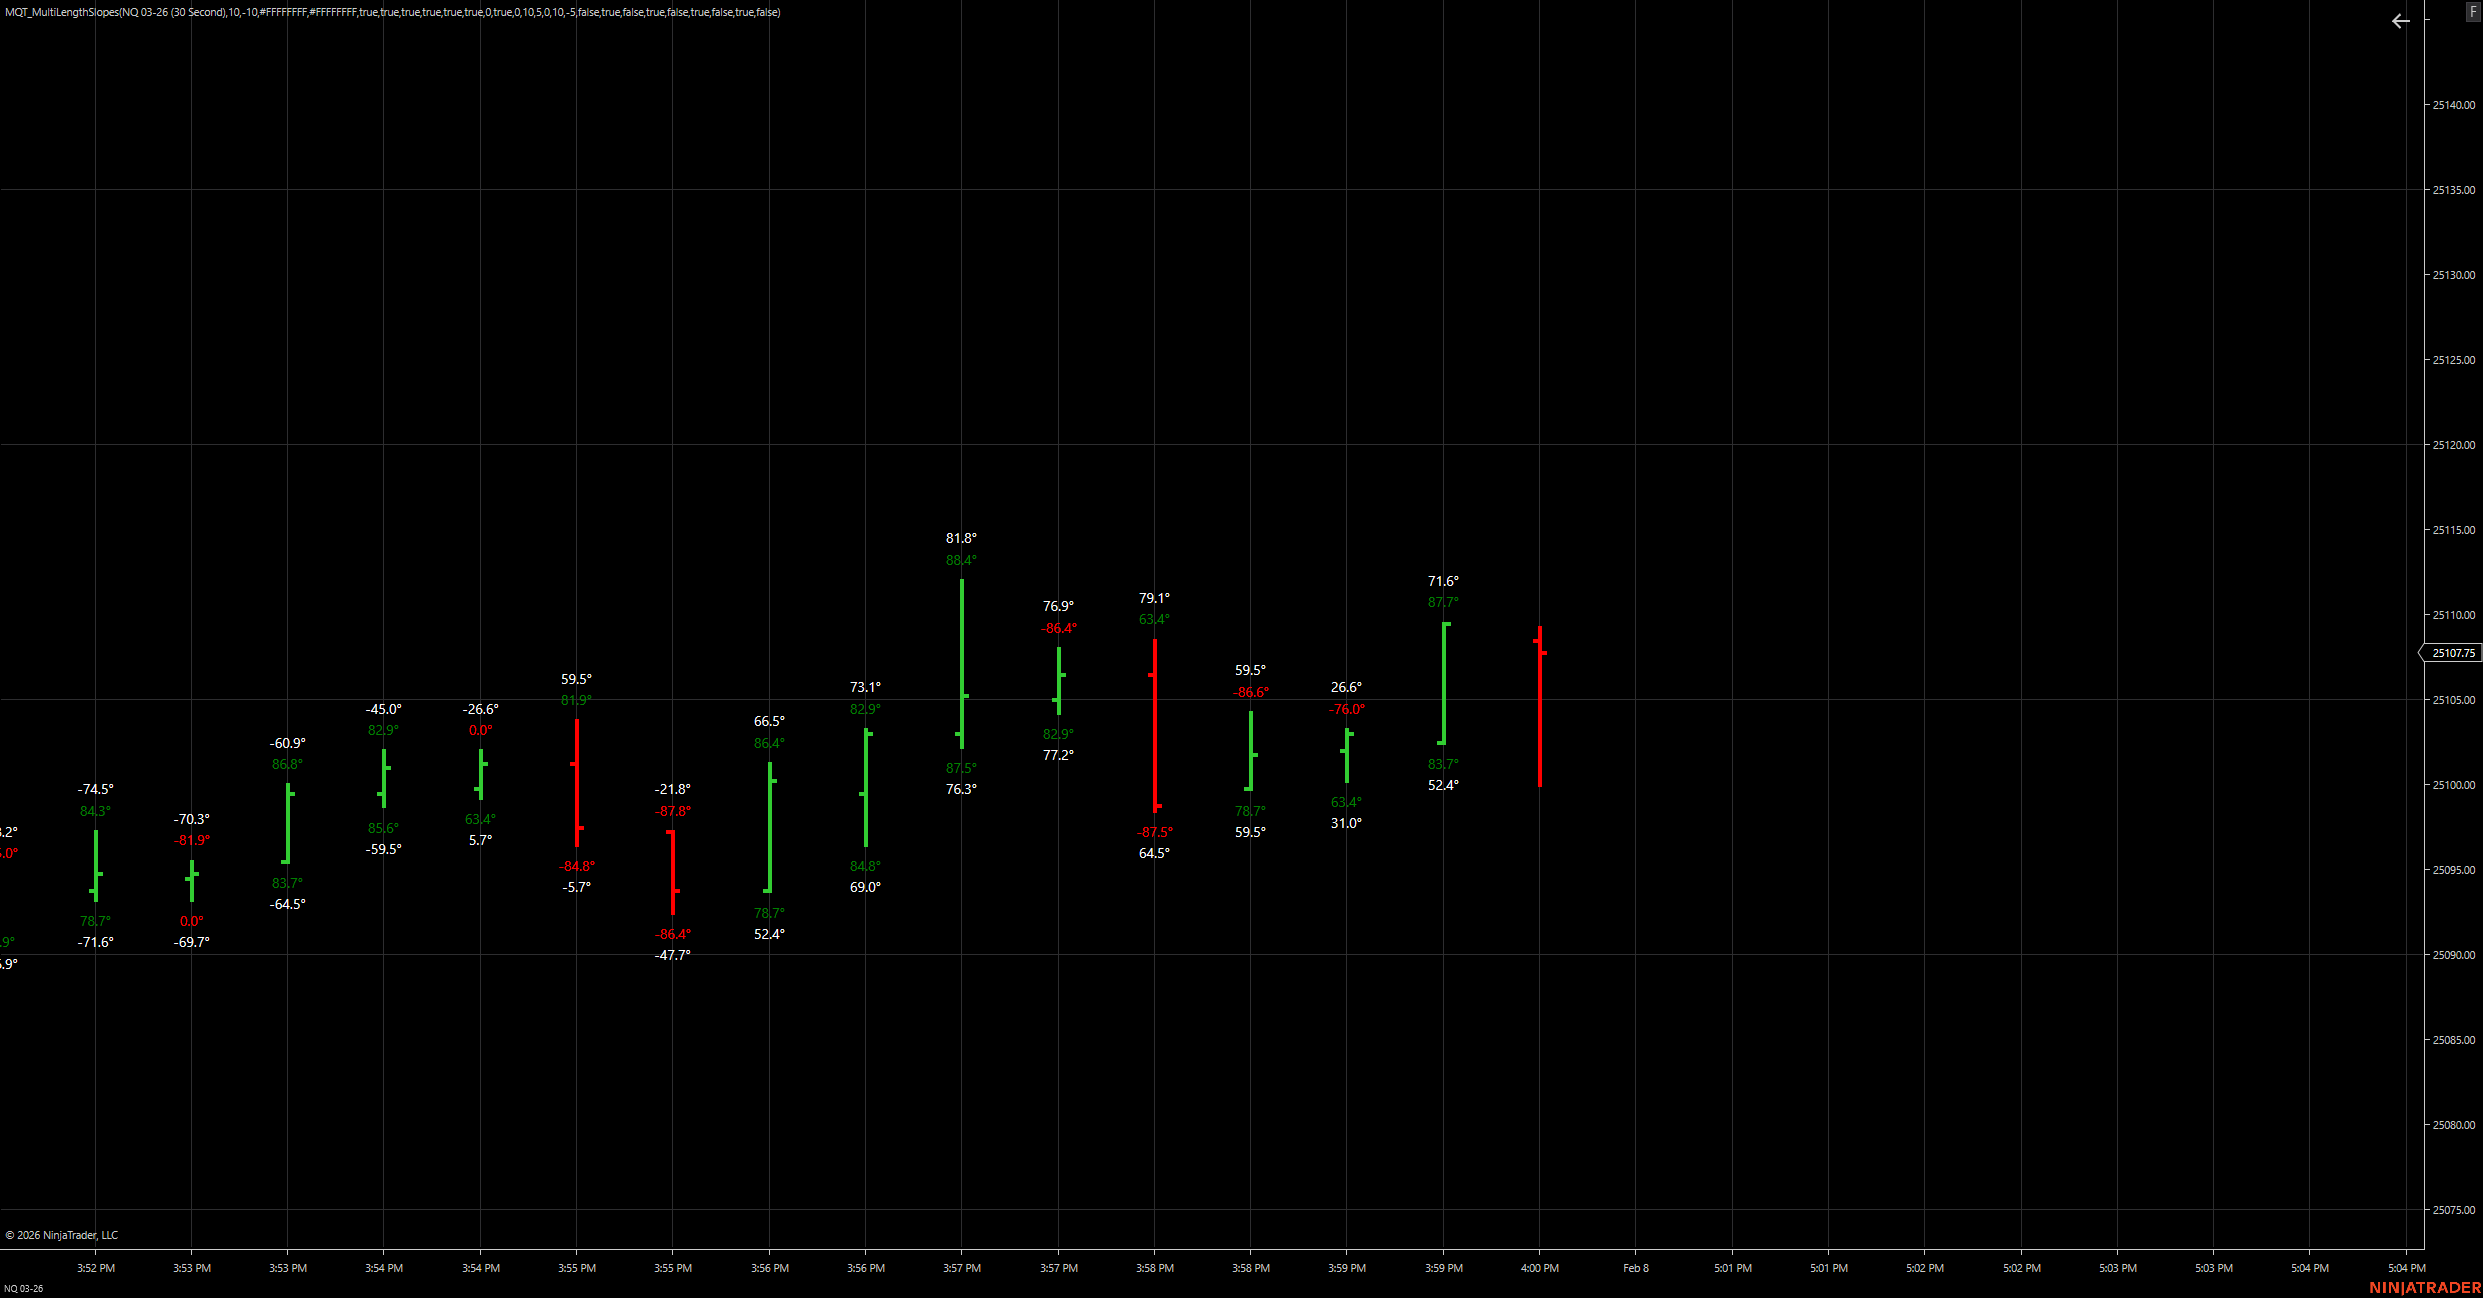
Degree labels plotted directly above and below price
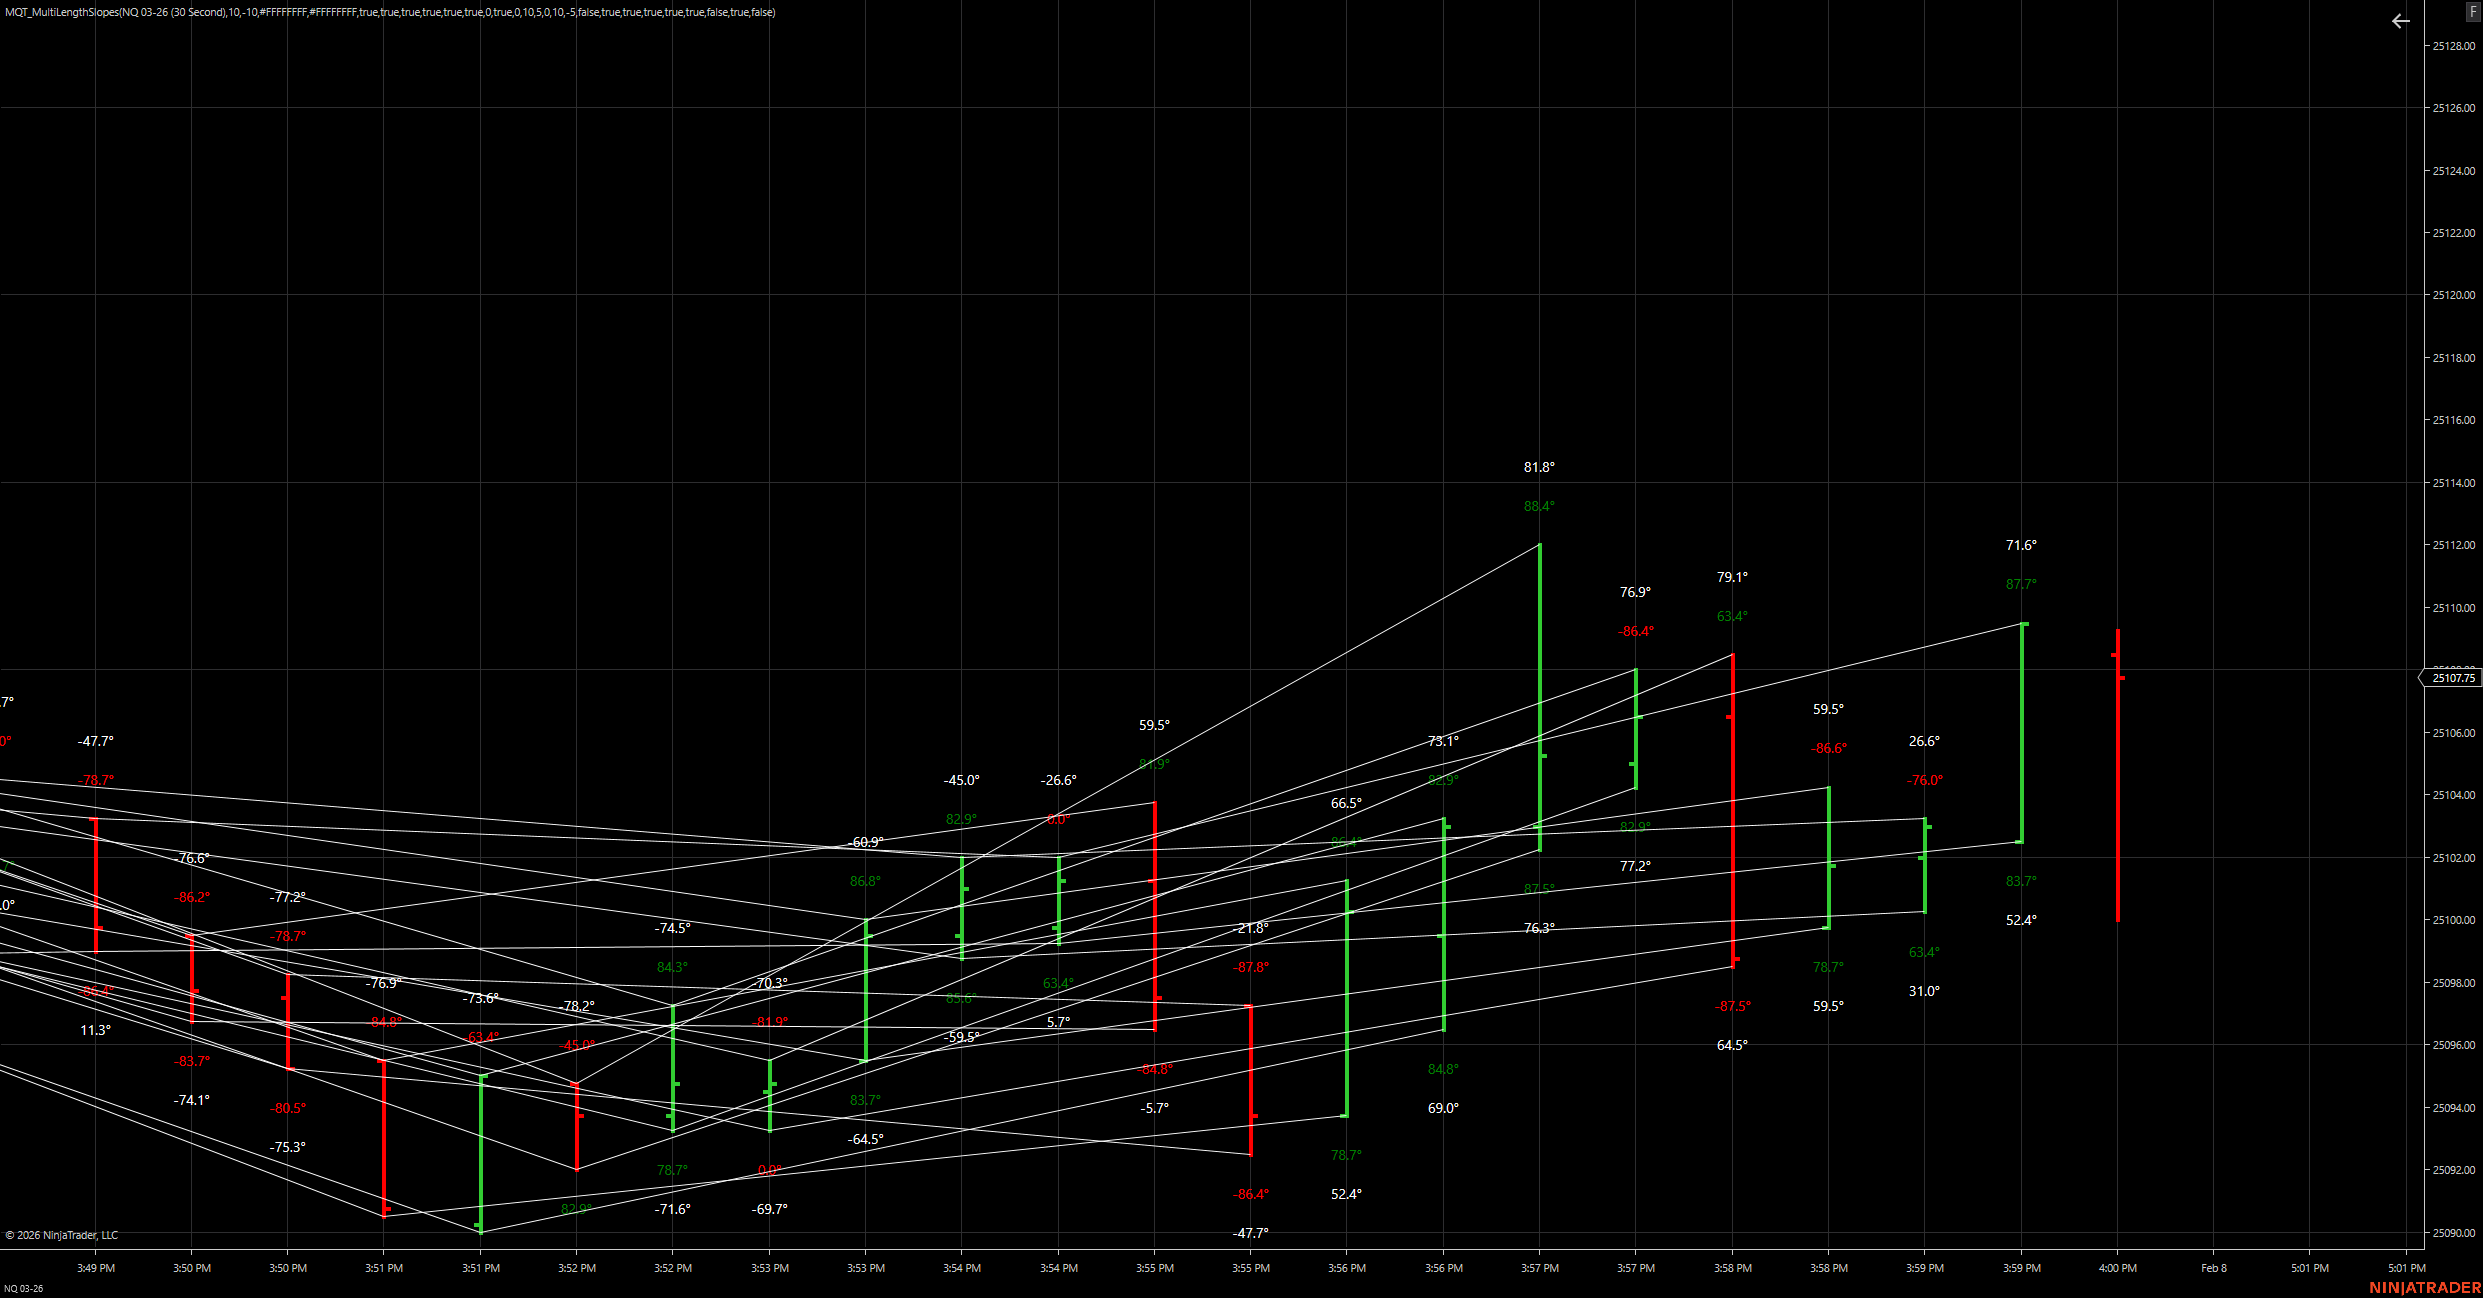
Custom bar‑to‑bar slope visualization across time
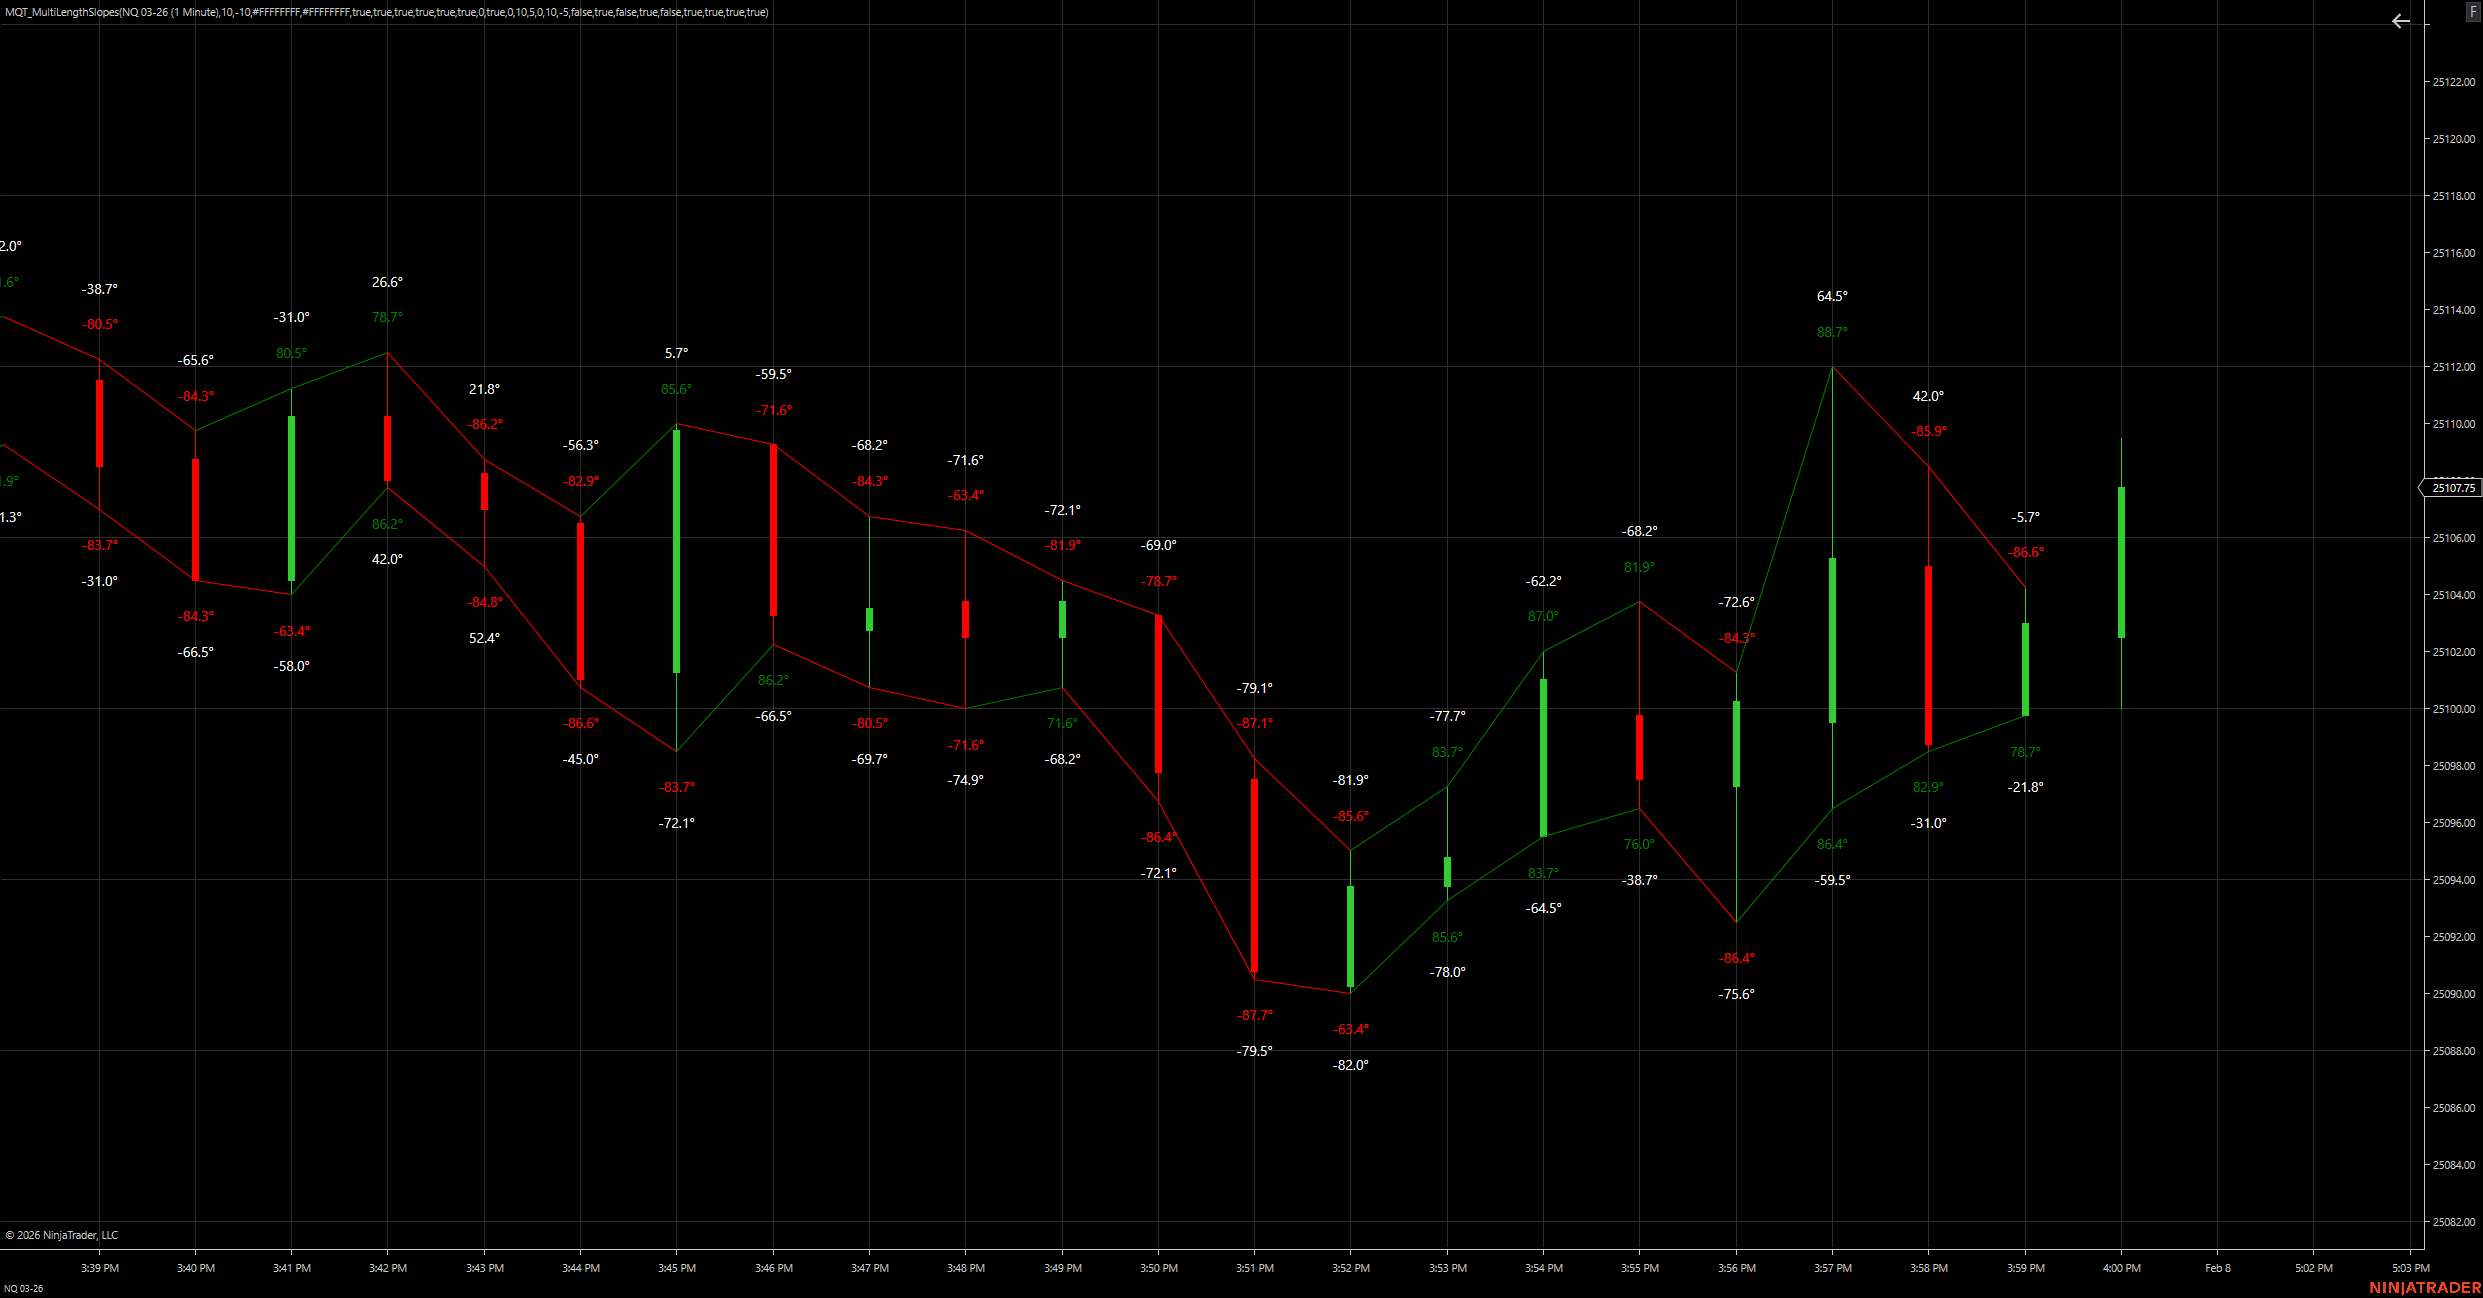
Combined slope degrees and connecting lines reveal momentum shifts
High and Low price changes are converted into slope degrees using tick size.
Flat slopes are optionally hidden to reduce noise.
Text labels and slope lines are plotted based on user settings.
Optional CSV export captures slope values for offline analysis.
No. Slopes are calculated using completed bars.
Yes. Enable “Only Current Bar” to show slopes only on the most recent bar.
Yes. Additional slopes allow you to specify any two bar offsets.
Documents → NinjaTrader 8 → export