
MQT_AvgDailyRange displays the average daily range (High - Low) for up to four configurable periods in a simple on-chart panel. Choose to display values in Points or Ticks, toggle individual periods on/off, and drag the panel to the corner you prefer (with optional snap-to-corner). Built for NinjaTrader 8 with a lightweight, clean display that stays out of your way.
Back to IndicatorsTrack multiple lookback windows (e.g., 5 / 10 / 20 / 50) to understand short-, mid-, and longer-term range behavior.
Choose DisplayUnits = Points or Ticks. The indicator formats values appropriately
using the instrument’s TickSize.
Toggle ShowPeriod1…ShowPeriod4 to keep the panel minimal and focused on what you actually use.
Drag the panel between corners by clicking the display block. Use SnapToCorner for quick placement.
Use LockPanel to prevent accidental movement.
Designed as a clean overlay panel on the price chart (no plots required). Great for discretionary trading and daily prep.
Includes a namespace-safe enum placement so the generated wrappers for Indicators/Strategies/Market Analyzer can resolve
AvgDisplayUnit reliably.
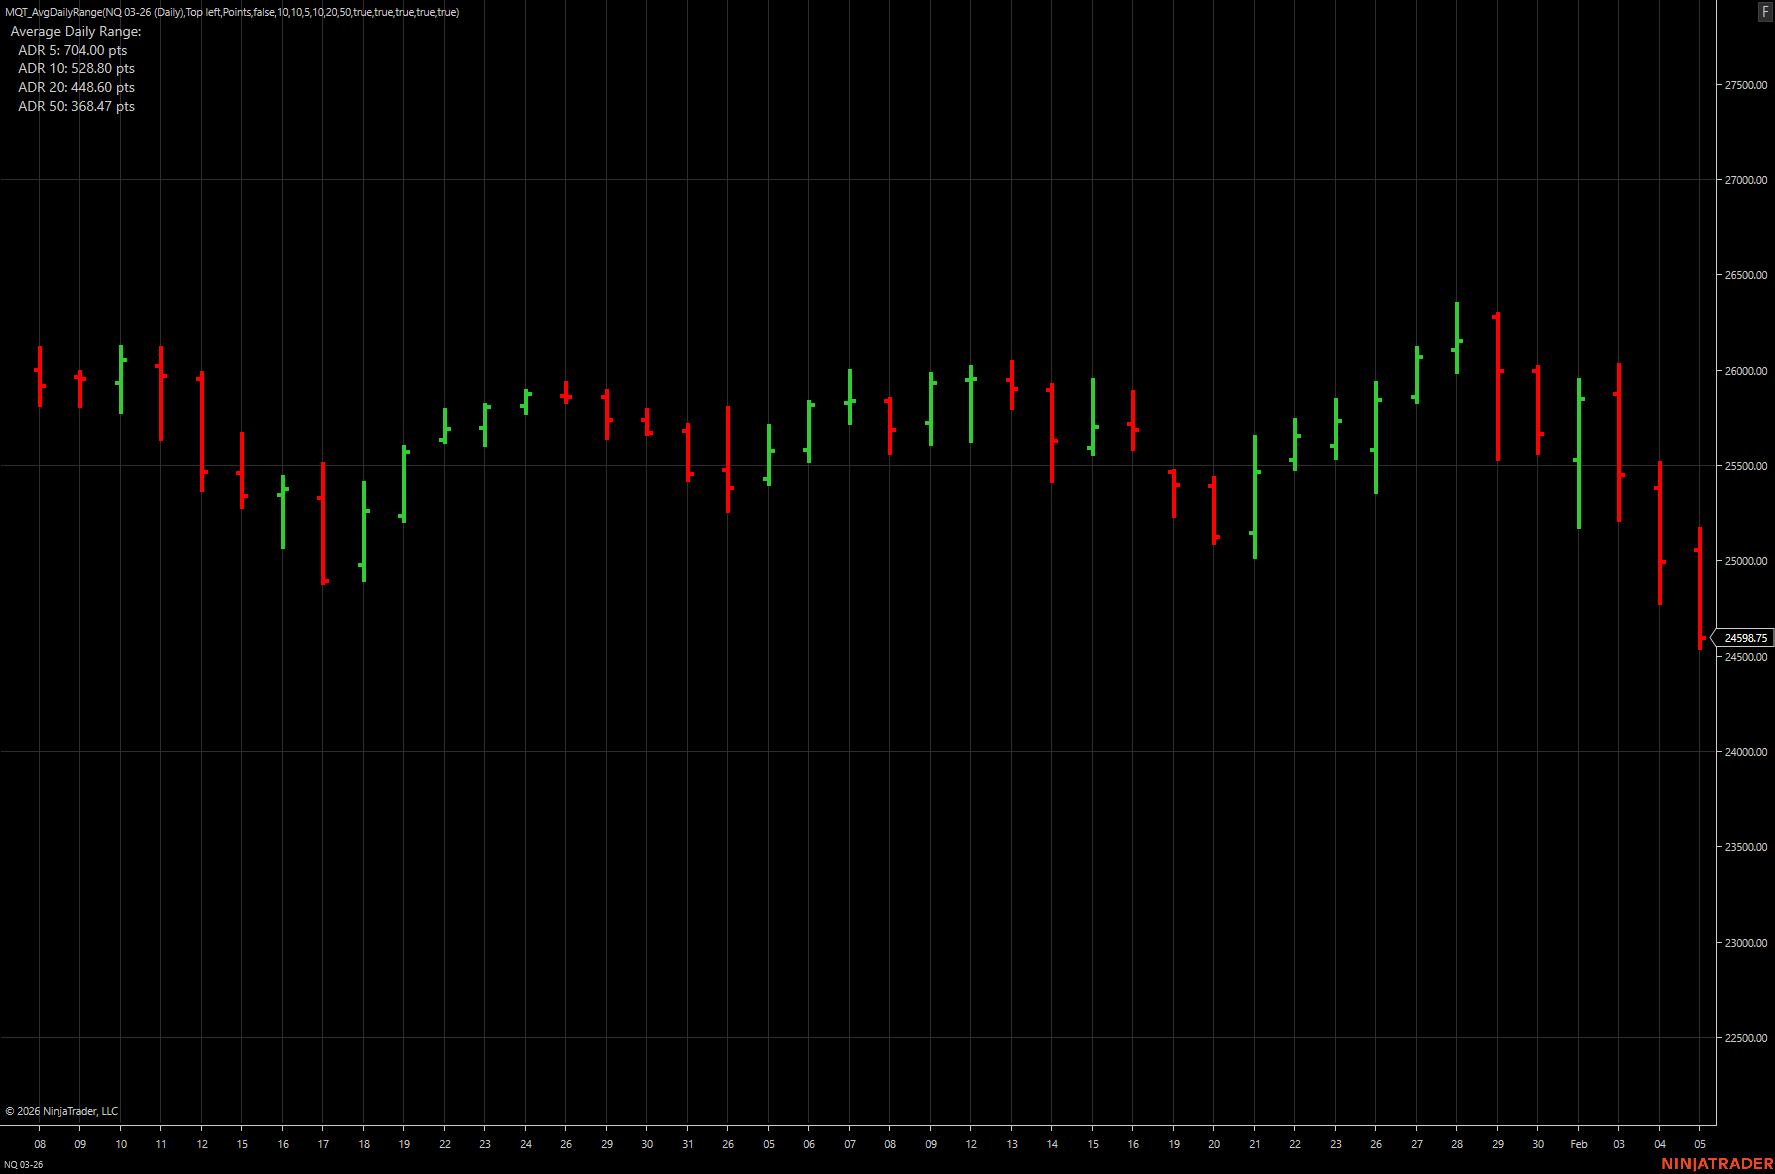
Panel display with ADR values shown in points
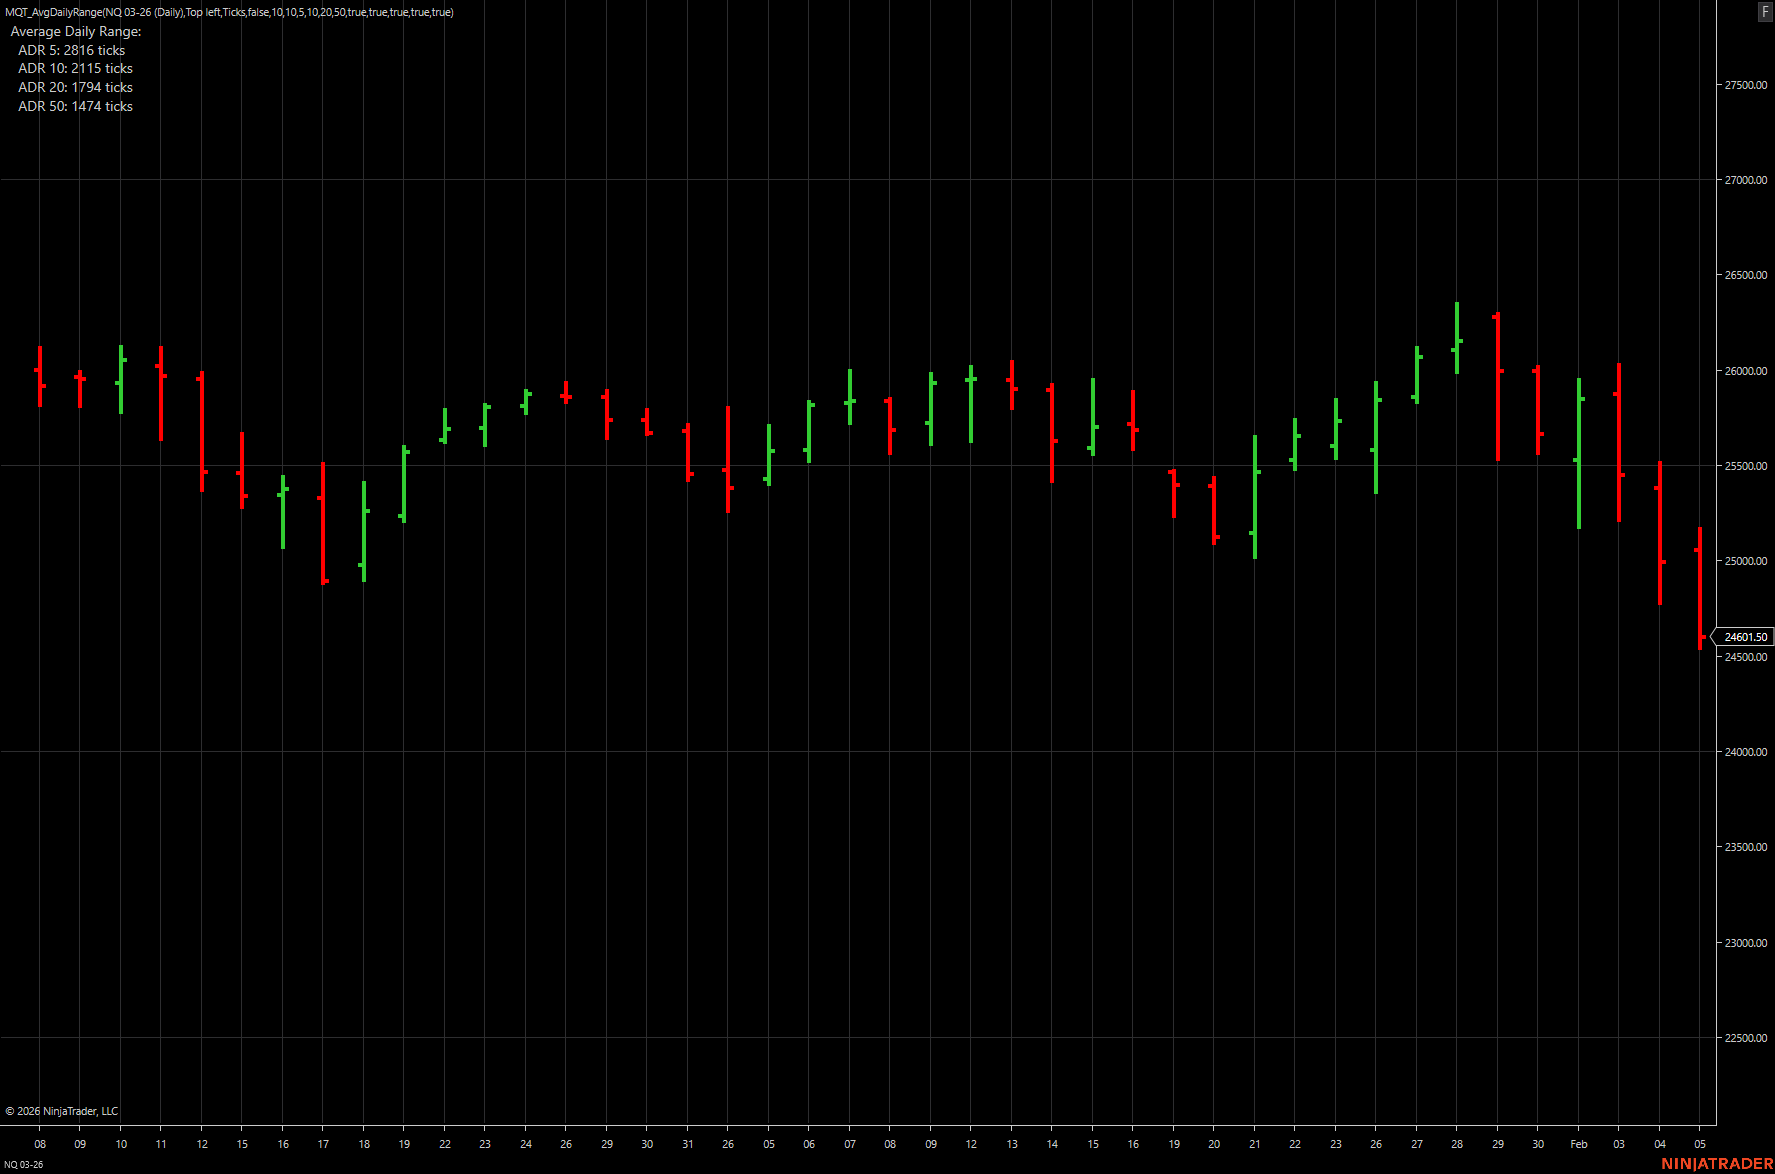
Same panel display with ADR values shown in ticks
On each bar close, the indicator calculates the daily range as High - Low and adds it to rolling sums for each enabled period.
Each period keeps a rolling sum and bar count, trimming older contributions once the count exceeds the period length.
Set DisplayUnits to Points (formatted with decimals) or Ticks (converted using TickSize and formatted as whole ticks).
The ADR panel is rendered using Draw.TextFixed. Optional mouse handlers let you drag it to the nearest corner,
or lock it in place.
| Parameter | Description | Default |
|---|---|---|
| Period1 | Lookback length for ADR 1. | 5 |
| Period2 | Lookback length for ADR 2. | 10 |
| Period3 | Lookback length for ADR 3. | 20 |
| Period4 | Lookback length for ADR 4. | 50 |
| ShowPeriod1 | Show ADR 1 line in the panel. | true |
| ShowPeriod2 | Show ADR 2 line in the panel. | true |
| ShowPeriod3 | Show ADR 3 line in the panel. | true |
| ShowPeriod4 | Show ADR 4 line in the panel. | true |
| DisplayUnits | Show averages in Points or Ticks. | Points |
| Anchor | Corner where the panel is anchored (TopLeft/TopRight/BottomLeft/BottomRight). | TopLeft |
| OffsetX | Horizontal offset from the anchor corner (hit-test and placement). | 10 |
| OffsetY | Vertical offset from the anchor corner (hit-test and placement). | 10 |
| LockPanel | Prevents moving the panel. | false |
| SnapToCorner | While dragging, snap the panel to the nearest corner. | true |
ADR is calculated as the average of the prior daily ranges, where each daily range is High - Low.
The indicator maintains separate rolling averages for up to four lookback periods.
Yes. Set Display Units (DisplayUnits) to Ticks. Values will be converted using
the instrument’s TickSize and displayed as whole ticks.
Yes. Use ShowPeriod1 through ShowPeriod4 to show only the periods you want.
Click and drag the panel. If Snap To Corner is enabled, it will snap to the nearest corner while dragging. If the panel won’t move, check Lock Panel.
No plots are required. The values are displayed in a fixed text panel using Draw.TextFixed,
keeping your chart clean and readable.
The indicator uses the currently loaded bar series. For best “daily range” meaning, apply it to a Daily series, or ensure your data series context matches how you want to interpret “daily” range.