
MQT_HighLowSlopePredictor learns statistically valid forward‑bar probabilities from recurring high and low slope sequences. Patterns are ranked by raw probability or Wilson lower‑bound stability and plotted directly on the chart with visual confidence cues.
Back to IndicatorsBucketized high/low slope sequences are continuously learned from daily data.
Tracks outcome probabilities from +1 through +N bars after a signal.
Choose between raw probability or Wilson lower‑bound stability scoring.
Visually flags low‑sample or statistically fragile patterns.
Render probabilities as labeled columns or compact heatmap blocks.
Export pattern statistics and rank top‑performing sequences.
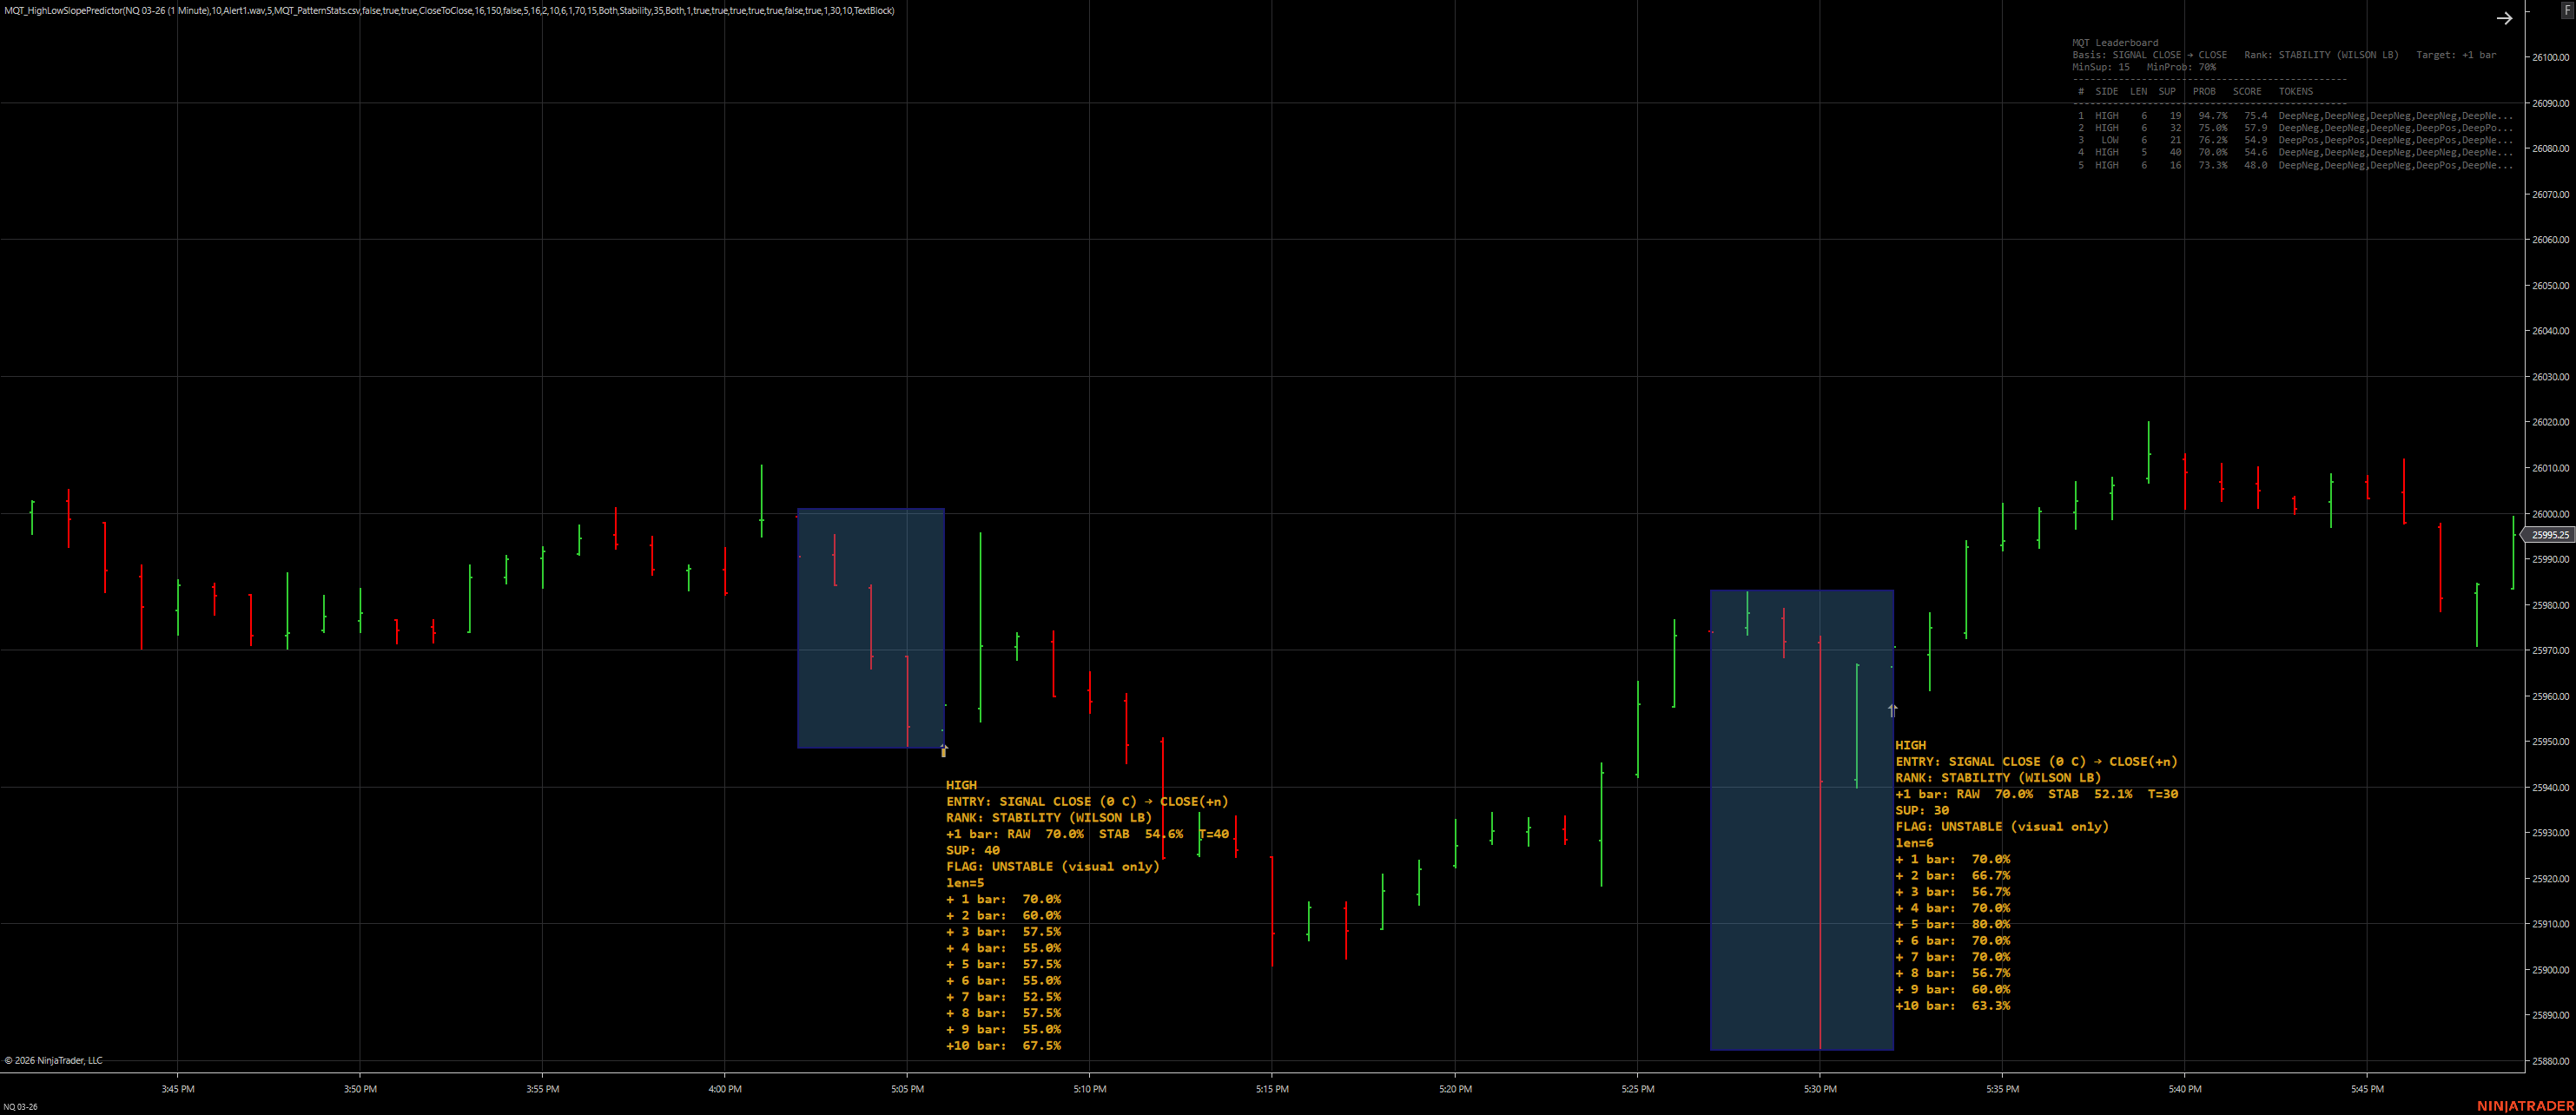
Forward probabilities displayed with stability‑aware labeling
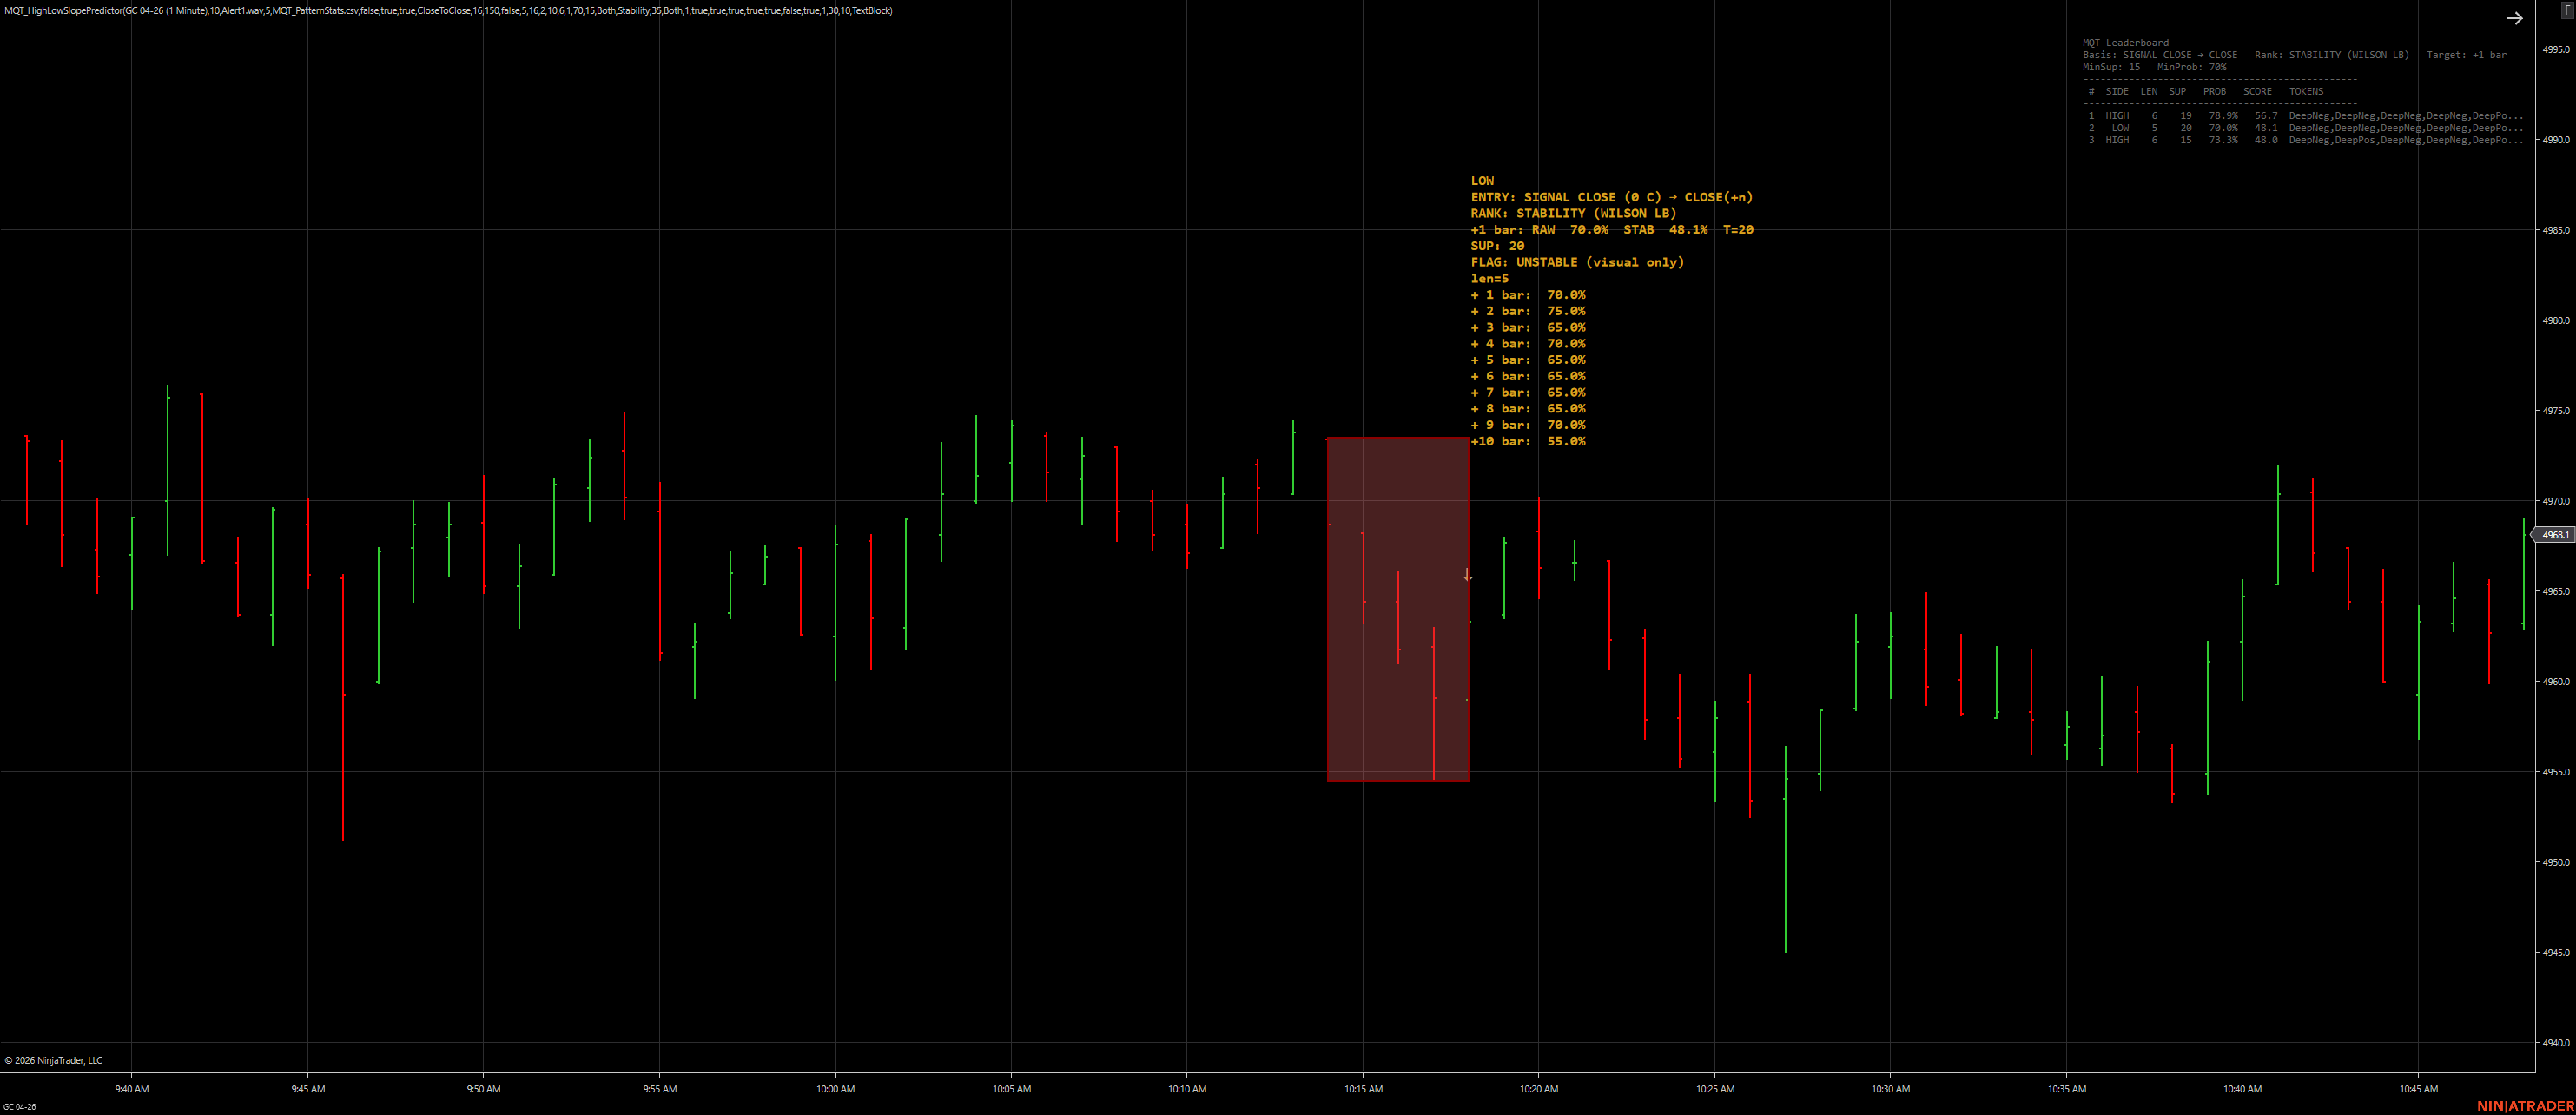
Automatic visual warnings for statistically weak signals
High and low slopes are converted into directional buckets.
Forward closes are tracked to build probability distributions.
Patterns are ranked by probability or statistical stability.
Qualified patterns are drawn with arrows, labels, and shading.
| Setting | Type | Typical Values | Description |
|---|---|---|---|
| Slope Bucket Size | Numeric | Small / Medium / Large | Controls how aggressively high/low slopes are grouped into repeating “tokens.” Smaller buckets create more unique patterns; larger buckets generalize more. |
| Sequence Length | Integer | 3–10 | Number of consecutive slope tokens used to define a pattern before calculating outcomes. |
| Forward Bars (N) | Integer | 1–20 | How many bars ahead the indicator measures outcomes and computes probability columns (+1 … +N). |
| Ranking Mode | Dropdown | Raw / Wilson | Ranks patterns by raw probability or by Wilson lower bound to favor stability when sample size is limited. |
| Minimum Sample Size | Integer | 20–200 | Filters out patterns that do not occur often enough to be statistically meaningful. |
| Unstable Pattern Threshold | Numeric | Low / Medium / High | Controls when the indicator visually flags a pattern as unstable (ex: too few occurrences or weak lower‑bound confidence). |
| Display Mode | Dropdown | Text / Heatmap | Choose between probability text columns or compact heatmap blocks. |
| Show Leaderboard | Boolean | On / Off | Displays a ranked list of top patterns based on the selected scoring mode. |
| CSV Export | Button / Boolean | On demand | Exports pattern stats (counts, probabilities, stability metrics) to CSV for spreadsheet review. |
| Color / Confidence Cues | Style | Default / Custom | Controls how strong vs weak patterns are colored or labeled on the chart. |
Note: The exact parameter names depend on the installed build of the indicator. If you paste the NinjaTrader property section for this indicator, I can convert the table above into exact names + default values (matching your code 1:1).
It does not forecast price directly. It measures how often certain slope sequences were followed by specific outcomes in the past and plots those probabilities for context.
Raw ranking favors the highest observed win rate. Wilson lower‑bound ranking penalizes low sample sizes and favors patterns that are statistically more stable.
Unstable flags typically indicate too few occurrences or insufficient statistical confidence. Increase the minimum sample size or use Wilson ranking for more conservative results.
Start small (ex: 1–5) to evaluate immediate follow‑through. Use larger values to study multi‑bar continuation, but expect more noise and fewer clean patterns.
Plotted probability blocks can update as new data arrives and as the pattern database grows. Once a bar is closed, its slope inputs are fixed; the statistical model can still evolve with more history.
It works anywhere slopes are meaningful, but results are instrument/timeframe dependent. Use the CSV export to validate what patterns are robust for your specific market.
Use larger bucket sizes, require higher minimum sample sizes, and prefer Wilson ranking. Always validate on out‑of‑sample periods before relying on any pattern set.
Typically: the slope token sequence, occurrence count, forward probabilities (+1…+N), and any stability or confidence metric used for ranking.