
MQT_DailyStrenghtPatterns scans daily candle “strength codes,” builds a historical pattern database (2–10 bars), and forecasts the next day’s direction when probability and occurrence filters are met. It can optionally highlight pattern bars, plot historical signals, and display a ranked performance table in the top-right of your chart.
Back to Indicators
Encodes each daily bar into a “strength code” (direction + bucket) and looks for repeating sequences of
2–10 bars to forecast UP or DN.
Reduce noise using MinProbability and MinOccurrences so only statistically meaningful
patterns are displayed.
Enter a comma-separated list in Disabled Pattern Names (example: DSP_L3_-2_1_4) to
ignore specific patterns in both the forecast and performance table.
Toggle Include Volume Change in Pattern to add volume change direction (_V-1/0/1) into
the pattern key for more granular pattern definitions.
Show the current forecast overlaying historical pattern signals. Optionally draw pattern boxes on the bars that
formed the signal (ShowPatternBars).
Display a ranked “TOP PATTERNS” list in the top-right (Show Performance Table) with configurable row
count (Performance Table Rows).
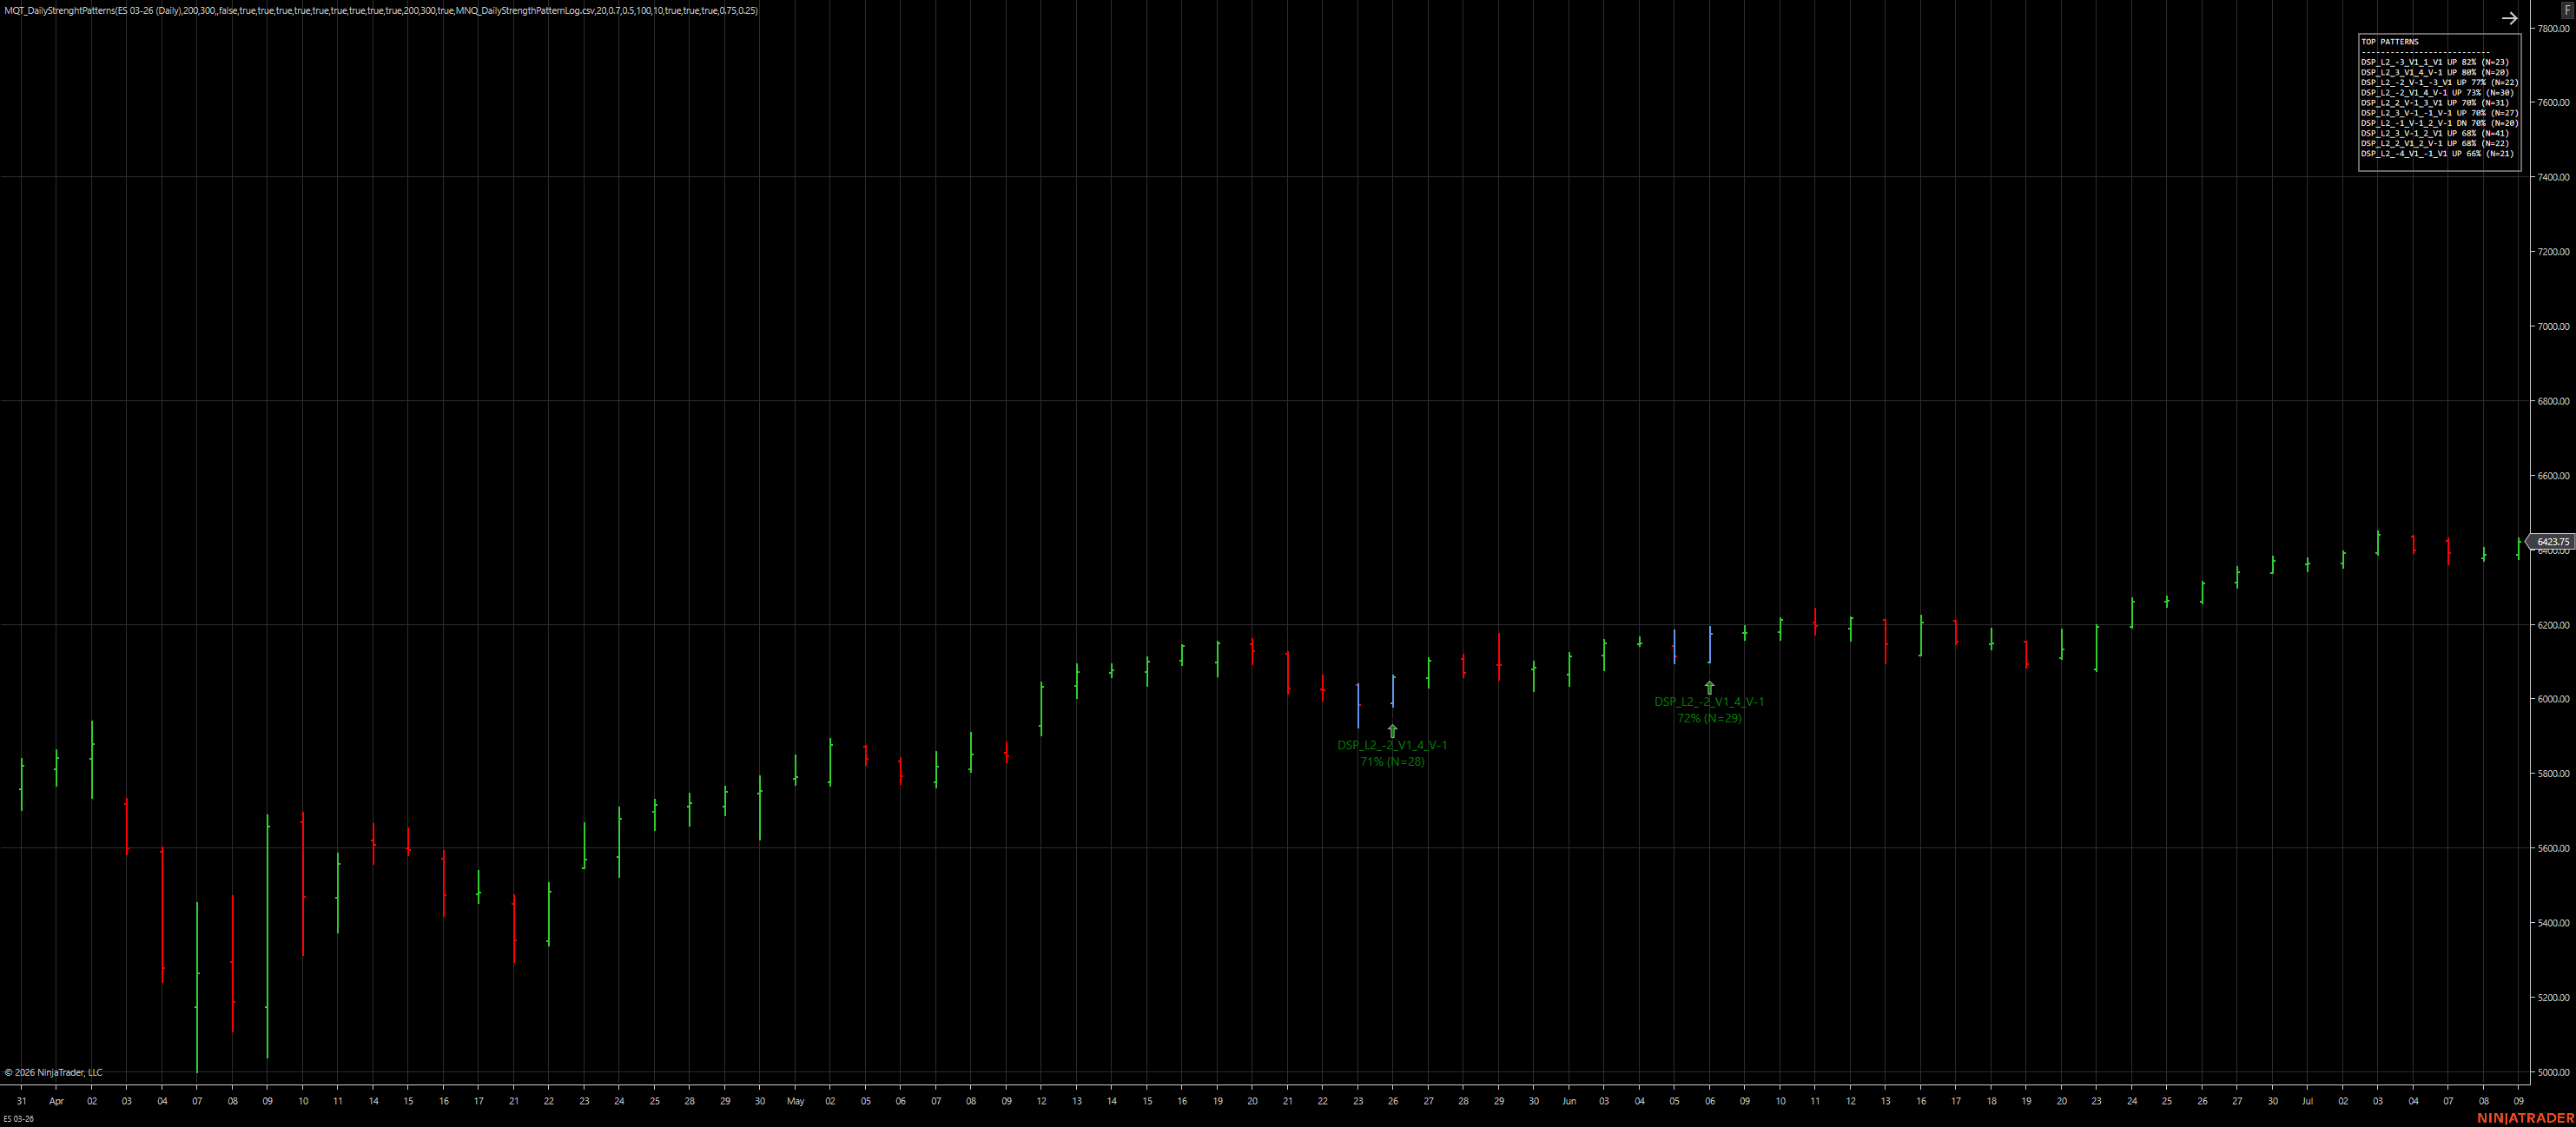
Example showing pattern calls on chart with performance table in the top-right
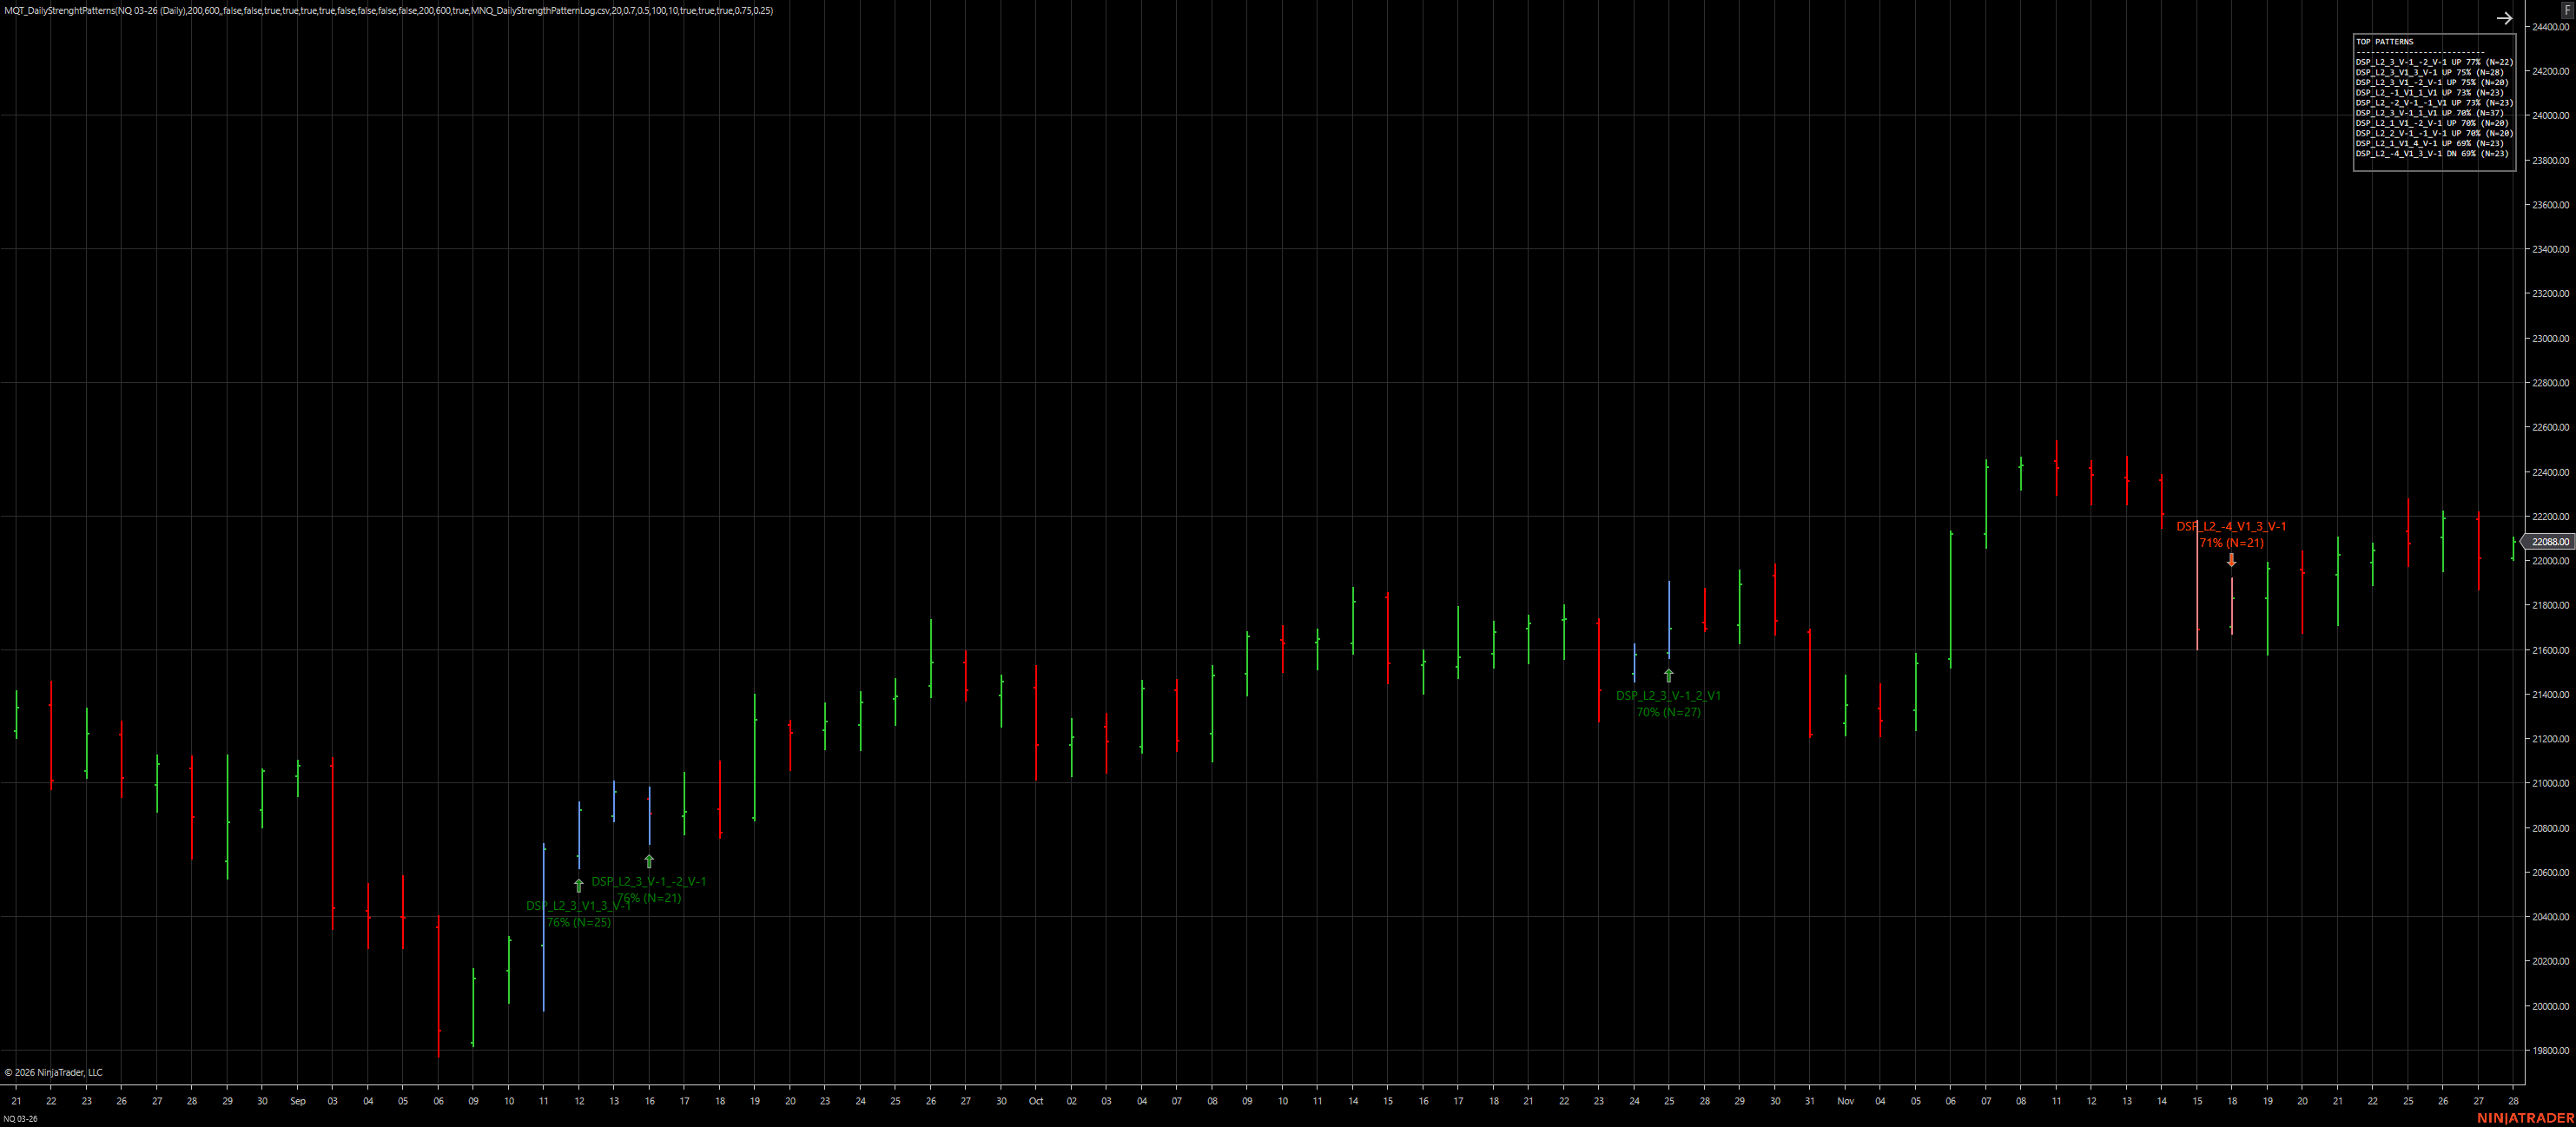
Daily strength pattern labels with probability and sample size (N)
Each daily bar is converted into a signed “strength bucket” based on body vs range: Weak / Moderate / Strong / Very Strong, plus direction.
For each enabled pattern length (2–10), the indicator tracks how often a pattern precedes UP vs DN outcomes.
Only patterns meeting MinOccurrences and MinProbability are eligible for forecast and
display (and excluded patterns are ignored).
The best-matching pattern is displayed as the current forecast. If enabled, a performance table ranks top patterns by probability.
| Parameter | Description | Default |
|---|---|---|
| WeakThreshold | Body-to-range magnitude below this is classified as “Weak”. | 0.25 |
| ModerateThreshold | Body-to-range magnitude below this (but above Weak) is “Moderate”. | 0.50 |
| StrongThreshold | Body-to-range magnitude below this (but above Moderate) is “Strong”; above it is “Very Strong”. | 0.75 |
| MinProbability | Minimum probability required for a pattern to be shown / considered. | 0.70 |
| MinOccurrences | Minimum sample size (N) required before a pattern is considered. | 30 |
| Disabled Pattern Names | Comma-separated list of pattern names to ignore (e.g. DSP_L3_-2_1_4). |
(blank) |
| Include Volume Change in Pattern | Add volume change direction (_V-1/_V0/_V1) into pattern keys. |
false |
| Enable 2-Bar Patterns | Include length-2 patterns in scanning and statistics. | true |
| Enable 3-Bar Patterns | Include length-3 patterns in scanning and statistics. | true |
| Enable 4-Bar Patterns | Include length-4 patterns in scanning and statistics. | true |
| Enable 5-Bar Patterns | Include length-5 patterns in scanning and statistics. | true |
| Enable 6-Bar Patterns | Include length-6 patterns in scanning and statistics. | true |
| Enable 7-Bar Patterns | Include length-7 patterns in scanning and statistics. | true |
| Enable 8-Bar Patterns | Include length-8 patterns in scanning and statistics. | true |
| Enable 9-Bar Patterns | Include length-9 patterns in scanning and statistics. | true |
| Enable 10-Bar Patterns | Include length-10 patterns in scanning and statistics. | true |
| ShowPatternBars | Draw boxes around the bars that make up a detected pattern. | true |
| ShowAllHistoricalPatterns | Show all qualifying historical patterns (can be visually busy). | false |
| Show Performance Table | Show the “TOP PATTERNS” table in the top-right. | true |
| Performance Table Rows | How many rows to show in the performance table. | 10 |
| Current Arrow Distance (Ticks) | Distance from bar (ticks) for the current forecast arrow. | 5 |
| Current Label Distance (Ticks) | Extra distance (ticks) from arrow to label for the current forecast. | 10 |
| Historical Arrow Distance (Ticks) | Distance from bar (ticks) for historical arrows. | 3 |
| Historical Label Distance (Ticks) | Extra distance (ticks) from historical arrows to their labels. | 5 |
| Pattern Bar Label Distance (Ticks) | Offset (ticks) for the pattern-bar label placement. | 5 |
| EnableFileLog | Write a CSV log of detected patterns to your NinjaTrader user folder. | false |
| LogFileName | CSV filename used when file logging is enabled. | MNQ_DailyStrengthPatternLog.csv |
This indicator is designed for Daily charts. It classifies each day’s candle and looks for repeating multi-day patterns.
Increase MinProbability and/or MinOccurrences, disable longer pattern lengths, and keep ShowAllHistoricalPatterns off.
Add it to Disabled Pattern Names as a comma-separated list (use the same pattern name shown on the chart/performance table).
It ranks qualifying patterns by their historical probability (based on UP vs DN counts), limited to your chosen number of rows.
Yes—enable EnableFileLog and set LogFileName. The indicator writes to a Logs folder under your NinjaTrader user directory.