
MQT_BuySellPressure estimates buy vs sell volume pressure using each bar’s OHLC structure and volume, smooths the result with configurable EMAs, and displays a clean “Buy Pressure” or “Sell Pressure” readout on your chart when one side dominates above 50%. Optional pulse/flash behavior highlights extreme pressure conditions so you can spot momentum shifts faster.
Back to IndicatorsOnly one line is displayed at a time: Buy Pressure when buy > 50%, or Sell Pressure when sell > 50%. If neither side dominates, nothing is drawn.
Uses EMA smoothing on estimated buy and sell volumes with independent lengths:
BuyVolumeAvgLength and SellVolumeAvgLength.
Enable flashing when pressure exceeds FlashThresholdPercent, with adjustable speed via
FlashIntervalMs.
Drag-and-drop the display anywhere on your chart. Configure sizing and placement with
PanelWidth, PanelHeight, PanelX, and PanelY.
Use UseRightAnchor to interpret PanelX as distance from the right edge,
perfect for consistent top-right positioning.
Choose FontWeightStyle, FontSizePx, and optional text shadow for better contrast:
EnableShadow, ShadowOpacity, ShadowOffsetX, ShadowOffsetY.
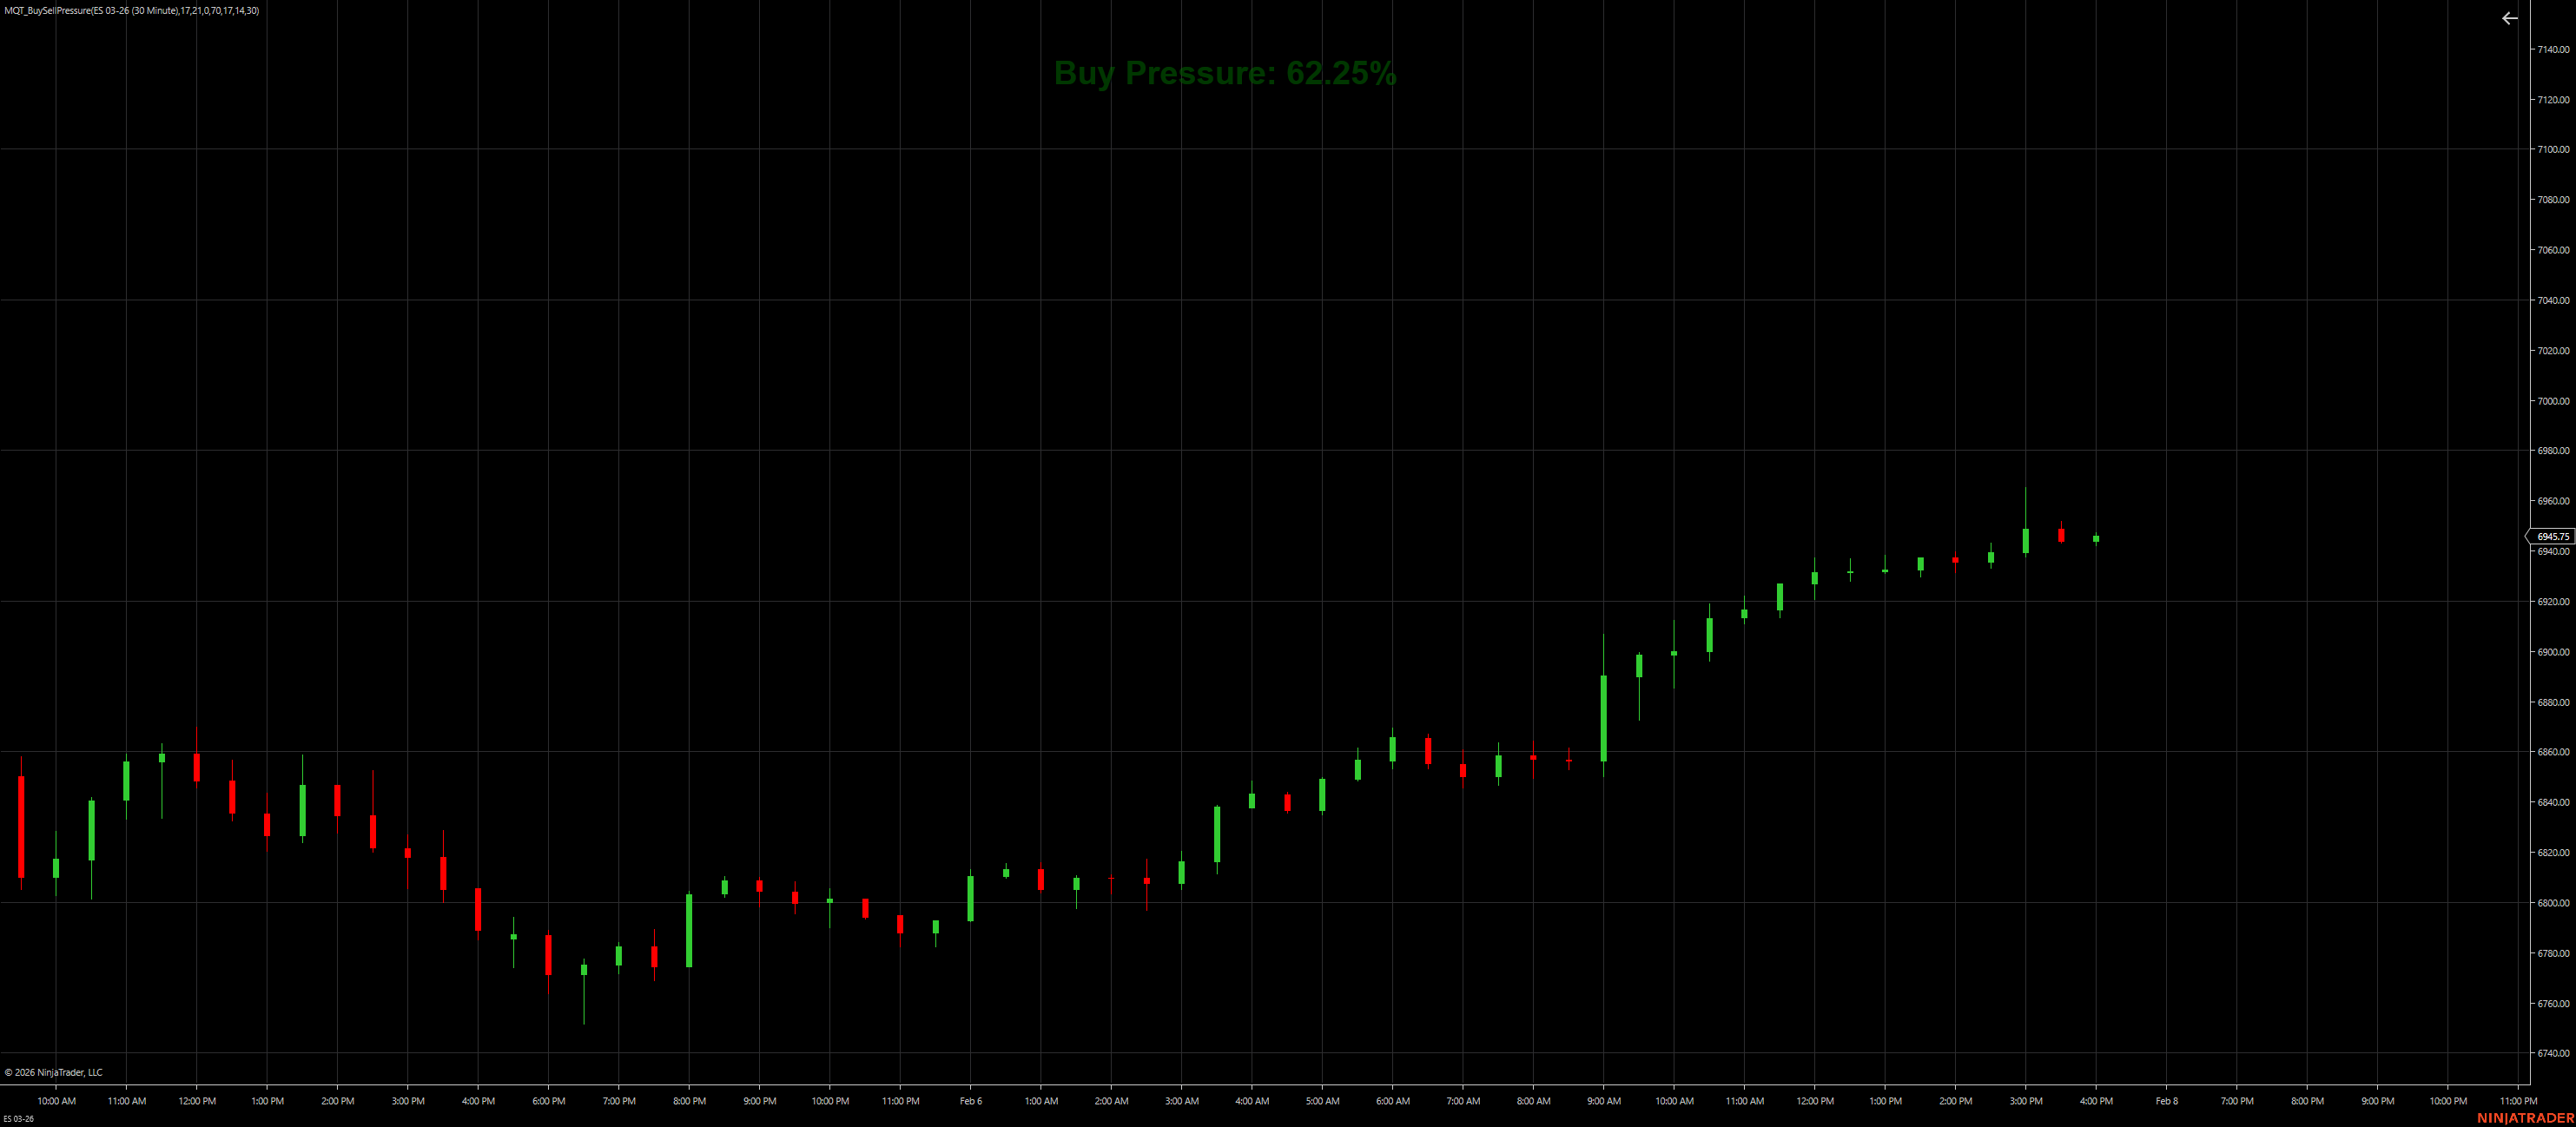
Shows only the dominant line when Buy Pressure is above 50%
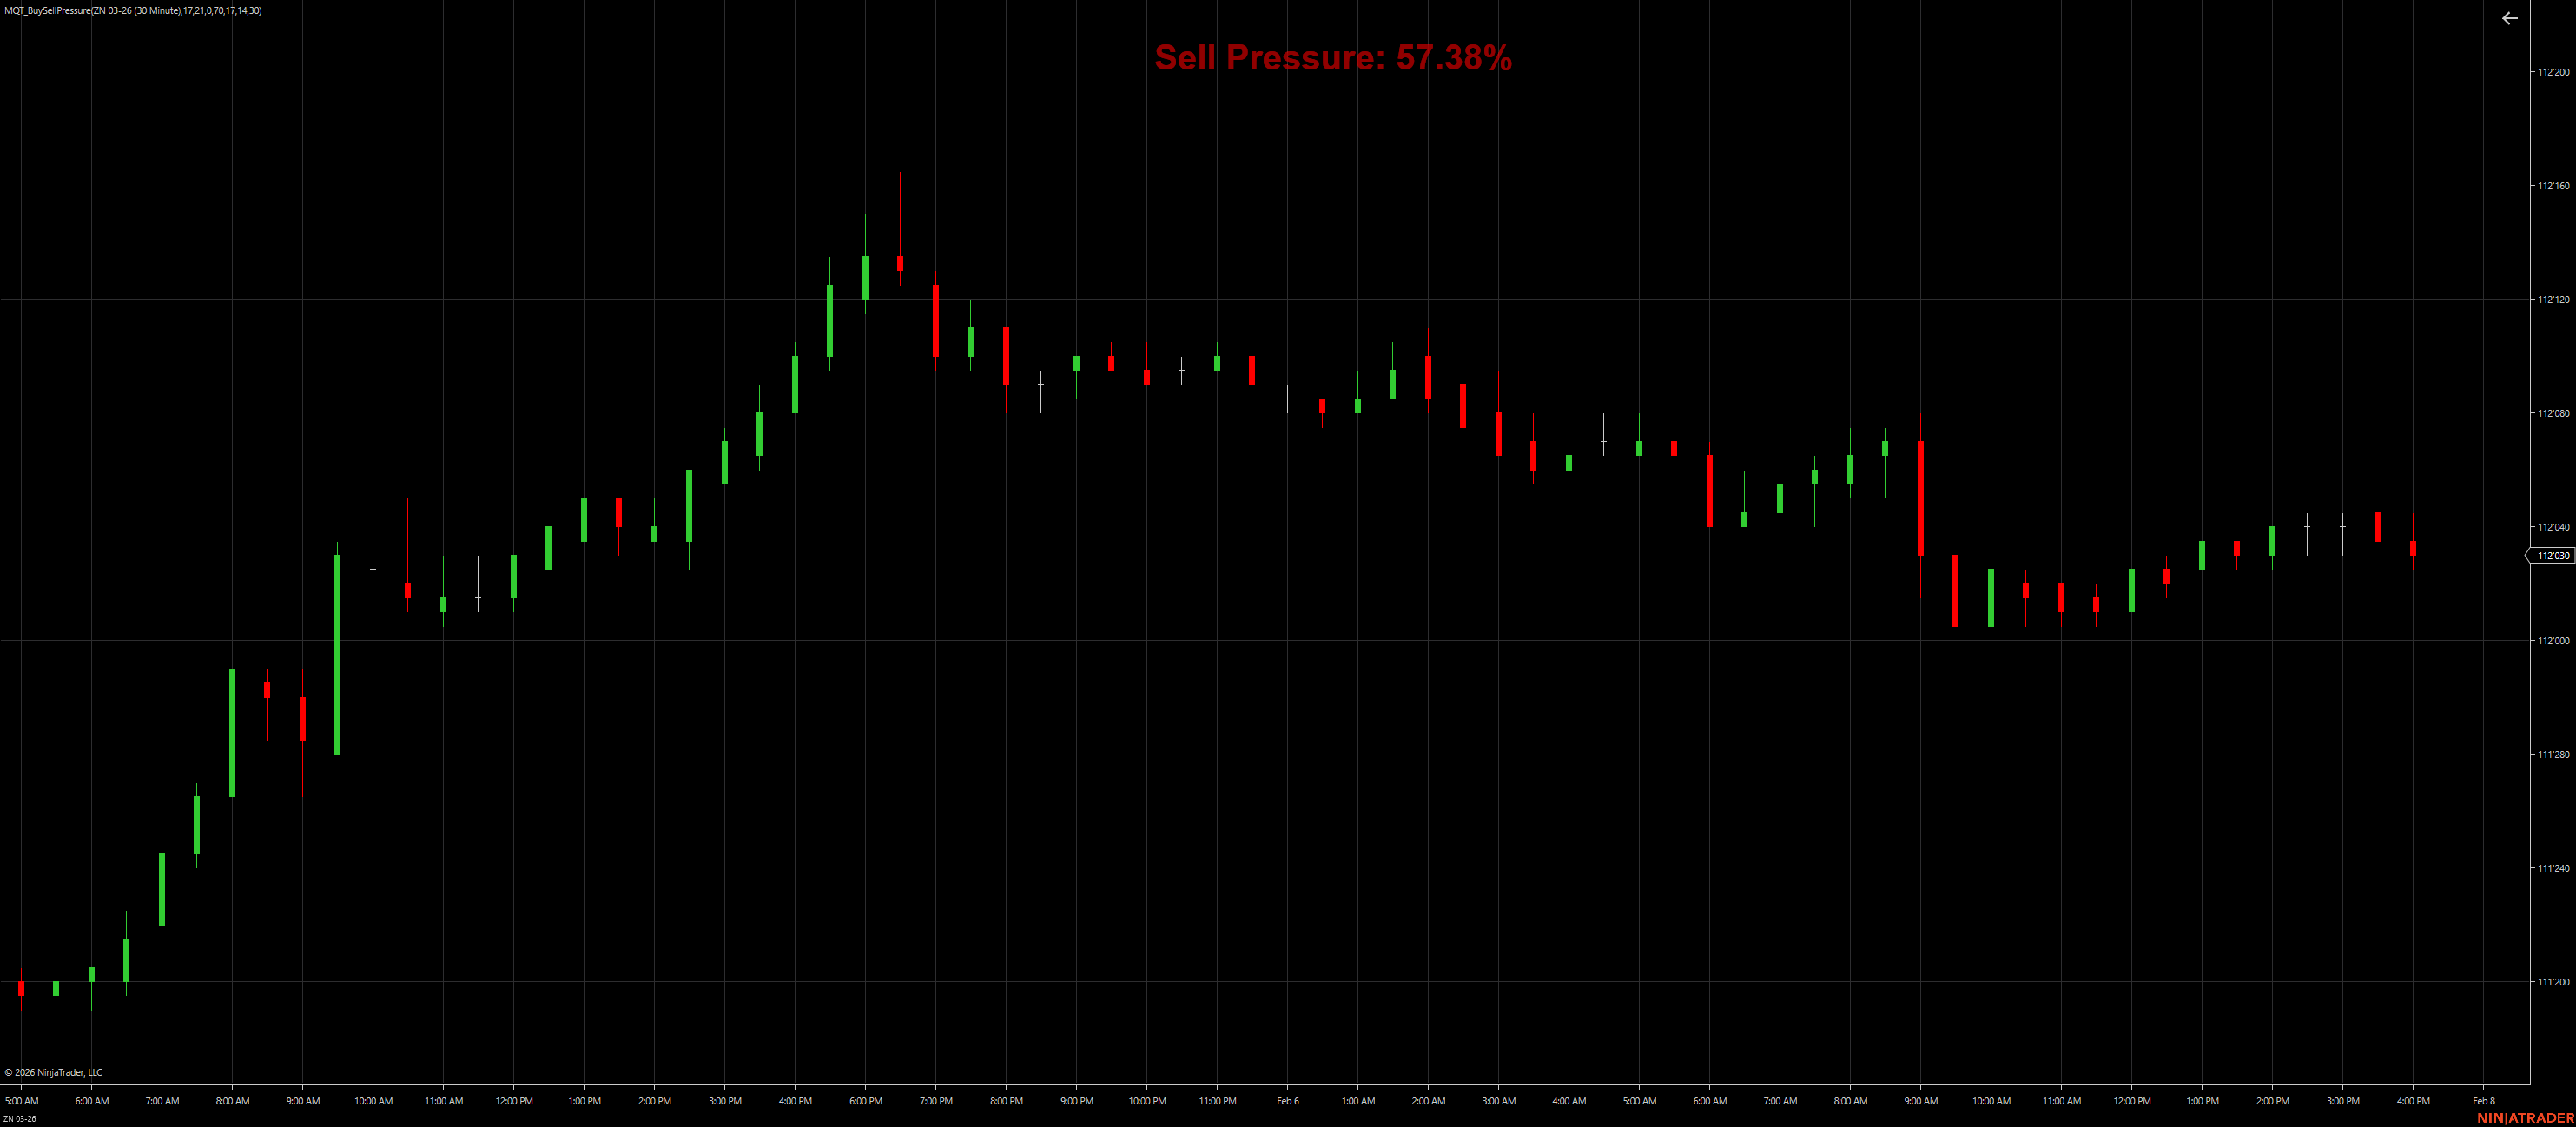
Displays Sell Pressure when selling dominates above 50%
Each bar’s OHLC structure is used to estimate “raw” buy and sell volume portions, scaled by the bar’s total volume.
Buy and sell series are smoothed using EMAs with independent lengths to reduce noise and stabilize the percentage.
Buy% and Sell% are computed from the smoothed totals so the two sides always sum to ~100%.
If Buy% > 50%, show Buy Pressure. If Sell% > 50%, show Sell Pressure. Optional flashing highlights extremes.
| Parameter | Description | Default |
|---|---|---|
| BuyVolumeAvgLength | EMA length for smoothing the estimated buy volume series. | 17 |
| SellVolumeAvgLength | EMA length for smoothing the estimated sell volume series. | 17 |
| PressureThreshold | Pressure threshold input (available as a parameter; not used in the current render logic). | 70 |
| StartHour | Start hour for a time window input (parameter present; not used in current logic). | 14 |
| StartMinute | Start minute for a time window input (parameter present; not used in current logic). | 30 |
| EndHour | End hour for a time window input (parameter present; not used in current logic). | 21 |
| EndMinute | End minute for a time window input (parameter present; not used in current logic). | 0 |
| EnableFlash | Enable pulsing/flashing effect when pressure exceeds the flash threshold. | true |
| FlashThresholdPercent | Pressure level (%) required before the flash effect activates. | 50.0 |
| FlashIntervalMs | Flash cycle duration (ms). Lower values = faster pulse. | 400 |
| PanelWidth | Width of the display panel (pixels) used for hit testing and positioning. | 315 |
| PanelHeight | Height of the display panel (pixels) used for hit testing and positioning. | 70 |
| FontSizePx | Font size (pixels) for the pressure text. | 30 |
| UseRightAnchor | If true, PanelX is distance from the RIGHT edge; otherwise from the LEFT. |
true |
| PanelX | Horizontal offset (px). Interpreted from right edge when UseRightAnchor is true. |
20 |
| PanelY | Vertical offset (px) from the top of the chart panel. | 30 |
| FontWeightStyle | Font weight: Regular, SemiBold, Bold, ExtraBold. | Bold |
| EnableShadow | Draw a shadow behind the main text for readability. | true |
| ShadowOpacity | Shadow opacity (0–1). | 0.5 |
| ShadowOffsetX | Shadow X offset in pixels. | 1.5 |
| ShadowOffsetY | Shadow Y offset in pixels. | 1.5 |
By design, the indicator draws only the dominant side when its pressure is above 50%. If neither side is above 50%, it draws nothing to avoid indecision clutter.
No. It estimates buy/sell pressure from OHLC positioning within the bar and the bar’s total volume, then smooths the series using EMAs.
Increase BuyVolumeAvgLength and SellVolumeAvgLength to smooth the values more. You can also slow down flashing by increasing FlashIntervalMs.
Raise FlashThresholdPercent (for example, 60, 70, or higher) so pulsing only occurs when pressure is strong.
Yes. Click and drag the text panel on the chart. You can also control position via PanelX, PanelY and enable right-side anchoring with UseRightAnchor.
They are available as settings in this version, but the current code does not apply a time-window filter in its calculations/rendering. If you want time-window filtering added, tell me your exact desired behavior (RTH only, custom window, etc.).
It is exposed as a parameter, but the current render logic uses a fixed dominance threshold (> 50%) and the flash threshold. If you’d like PressureThreshold to control display/alerts, I can suggest a clean way to wire it in.