
MQT_BarSizeStudy ranks custom time-of-day slots by average bar size (High-Low) across all loaded history. Optionally display per-bar size labels (ticks/points/both), filter by RTH, select specific days of the week, and export detailed CSV reports. Perfect for traders who want to pinpoint high-volatility windows and optimize entry timing.
Back to IndicatorsDefine your own slot size (in seconds) and the indicator ranks each time-of-day window by average bar size (High-Low in ticks).
Display a live on-chart window showing the top N most volatile time slots with average, max, and observation counts—updated every N bars.
Optionally show labels under each bar displaying size in Ticks, Points, or Both—with configurable displacement and color.
Use UseRthWindow to filter slot statistics to Regular Trading Hours only, or leave it off to analyze the full session.
Enable/disable specific days (Sunday–Saturday) to focus your analysis on the trading days that matter most to your strategy.
Export a detailed CSV file with all time slots ranked by average bar size, including max values, timestamps, and observation counts.
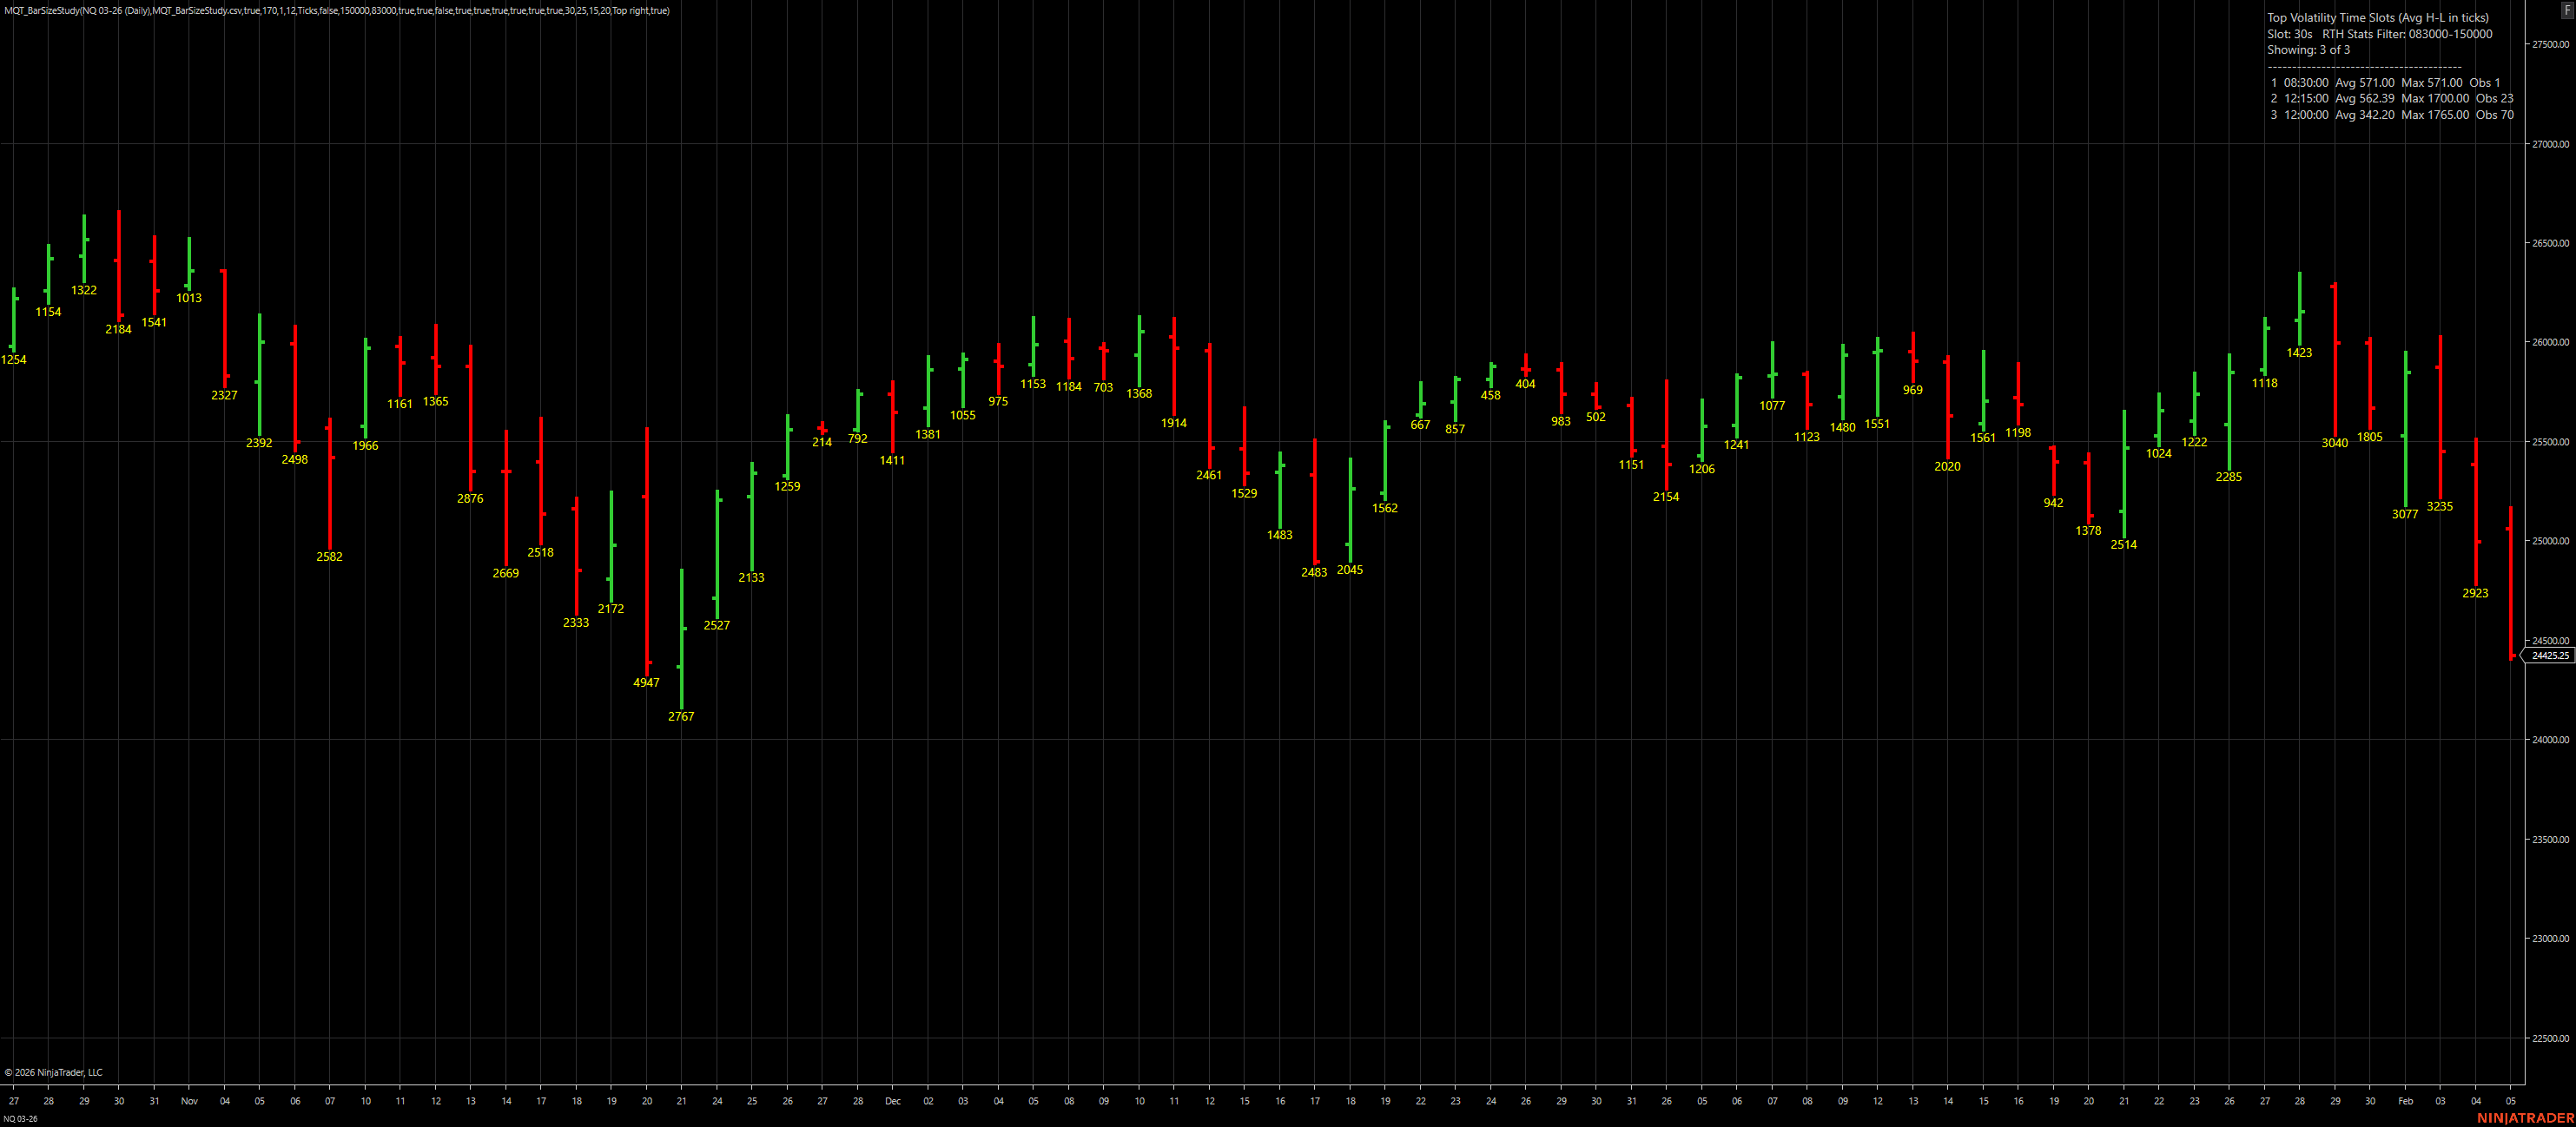
Per-bar labels showing size in ticks with Top Volatility Window in upper-right corner
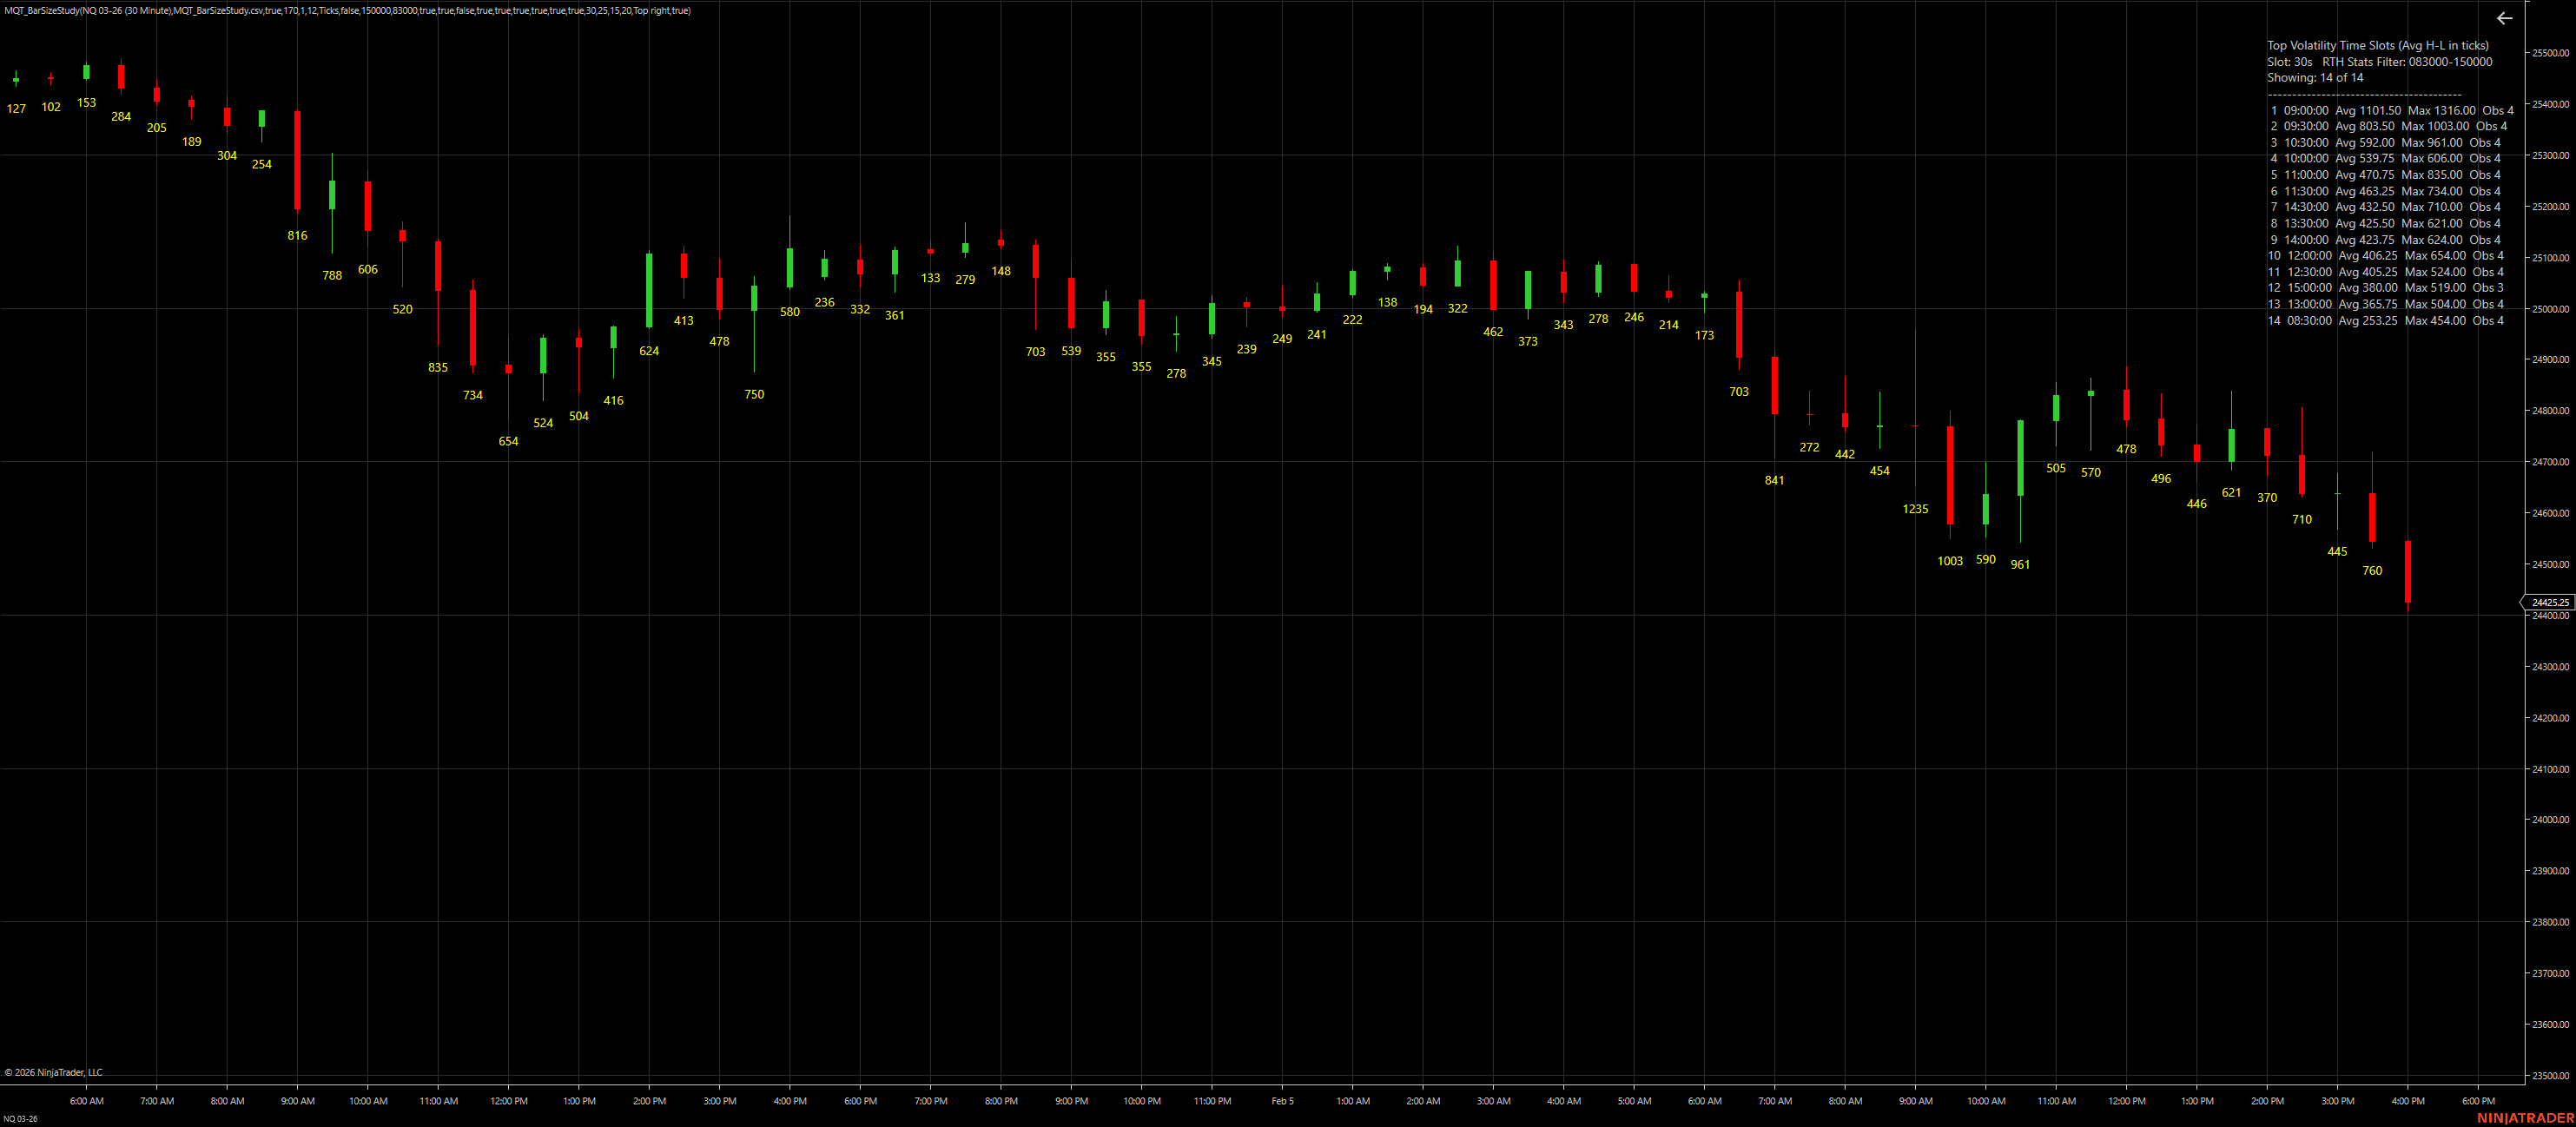
Top Volatility Window displays ranked time slots with average, max, and observation counts
Set SlotSeconds (e.g., 30 seconds) to divide the trading day into custom windows. The indicator tracks each slot's average bar size (High-Low in ticks).
As bars close, the indicator accumulates statistics for each time slot across all loaded history, optionally filtering by RTH and selected days of the week.
Enable ShowTopVolatilityWindow to see a live on-chart ranking of the top N most volatile time slots, updated every N bars with average, max, and observation counts.
When the indicator reaches real-time or terminates, it prints the top N slots to the Output window and optionally exports a full CSV report for deeper analysis.
| Parameter | Description | Default |
|---|---|---|
| TopN | Number of top-ranked time slots to print to the Output window and include in the CSV export. | 25 |
| SlotSeconds | Size of each time-of-day slot in seconds (e.g., 30 = 30-second windows). | 30 |
| UseRthWindow | If true, only bars within the RTH window (defined by RthStartTime/RthEndTime) are included in slot statistics. | true |
| RthStartTime | RTH start time in HHmmss format (local PC time). Example: 83000 = 8:30:00 AM. | 83000 |
| RthEndTime | RTH end time in HHmmss format (local PC time). Example: 150000 = 3:00:00 PM. | 150000 |
| ExportCsv | If true, exports a CSV file with all time slots ranked by average bar size. | true |
| CsvFileName | Name of the CSV file to export (saved to NinjaTrader user data directory). | MQT_BarSizeStudy.csv |
| ShowTopVolatilityWindow | Display a live on-chart window showing the top N most volatile time slots. | true |
| TopVolatilitySlots | Number of top slots to display in the on-chart volatility window (1-50). | 15 |
| TopVolatilityWindowPosition | Position of the volatility window on the chart (TopLeft/TopRight/BottomLeft/BottomRight). | TopLeft |
| TopVolatilityUpdateEveryNBars | Update the volatility window every N bars (1 = every bar, higher = less frequent updates). | 20 |
| ShowBarSizeLabels | Display per-bar size labels under each bar. | true |
| LabelMode | Label display mode: Ticks, Points, or TicksAndPoints. | Ticks |
| LabelDisplacementTicks | Number of ticks below the bar's low to place the label (0-1000). | 2 |
| LabelFontSize | Font size for bar size labels (note: chart default text style is used on some NT8 builds). | 12 |
| LabelBrush | Color of the bar size labels. | DimGray |
| LabelOnlyDuringRth | If true, only show labels for bars that fall within the RTH window (independent of stats filter). | false |
| LabelEveryNBars | Show a label every N bars (1 = every bar, higher = less frequent labels). | 1 |
| RunSunday | Include Sunday bars in the analysis. | false |
| RunMonday | Include Monday bars in the analysis. | true |
| RunTuesday | Include Tuesday bars in the analysis. | true |
| RunWednesday | Include Wednesday bars in the analysis. | true |
| RunThursday | Include Thursday bars in the analysis. | true |
| RunFriday | Include Friday bars in the analysis. | true |
| RunSaturday | Include Saturday bars in the analysis. | false |
It divides the trading day into custom time slots (defined by SlotSeconds) and ranks each slot by average bar size (High-Low in ticks) across all loaded historical data.
Enable UseRthWindow and set RthStartTime and RthEndTime to your desired RTH window. Only bars within this window will be included in the slot statistics.
Yes. Enable ShowTopVolatilityWindow to display a live on-chart window showing the top N most volatile time slots, updated every N bars with average, max, and observation counts.
When ShowBarSizeLabels is enabled, the indicator displays the size of each bar (High-Low) under the bar. You can choose to display in Ticks, Points, or Both.
Yes. LabelOnlyDuringRth filters only the labels (independent of the stats filter). You can also use LabelEveryNBars to reduce label frequency.
Enable ExportCsv and specify a CsvFileName. When the indicator reaches real-time or terminates, it exports a CSV file to your NinjaTrader user data directory with all time slots ranked by average bar size.
Yes. Use the Days group parameters (RunSunday, RunMonday, etc.) to enable/disable specific days. Only bars from enabled days will be included in the analysis.
It depends on your trading style. Scalpers might use 30-60 seconds, while swing traders might use 300-600 seconds (5-10 minutes). Experiment with different values to find the optimal window for your strategy.